IELTS Academic Writing Task 1- Task Achievement/Task Response:
Charts, Graphs, Tables
In Academic Writing Task 1 of the IELTS exam, you will be given a chart, graph, table or diagram and asked to describe and summarize the information in your own words. The task requires you to:
- Analyze the information presented: Carefully examine the chart/graph/table/diagram and understand the main features, trends, and patterns.
- Identify the key points: Determine the most important information that needs to be conveyed in your response.
- Organize your writing: Plan how you will present the information in a logical and clear manner. This could involve grouping related data, comparing and contrasting different aspects of the information, and using appropriate vocabulary to describe trends.
- Write a clear and concise response: Use correct grammar, spelling and punctuation, and stay within the word count limits. Ensure that you have addressed all parts of the question and that your response is relevant to the task.
To achieve a high score in Task Achievement/Task Response, make sure you have fully answered the question asked and provided all the required information. Your response should be well-organized and easy to follow, with accurate use of data and appropriate vocabulary. Additionally, ensure that you have used a variety of sentence structures and linked your ideas coherently to achieve a smooth flow of information.
Process Diagrams
In Academic Writing Task 1 of the IELTS exam, you may also be presented with a process diagram, which shows a sequence of steps or stages involved in a particular process. To achieve high marks in Task Achievement/Task Response, you should:
- Analyze the process: Study the diagram carefully to understand the different stages involved in the process, and identify the key features and components.
- Plan your writing: Plan how you will present the information in a logical and clear manner, highlighting the most important stages of the process.
- Write an overview: Write an introduction that provides an overview of the process and the purpose of the process.
- Describe the process: Use a variety of sentence structures to describe the process in detail, using appropriate vocabulary and accurate information. Your description should be well-organized and easy to follow.
- Write a conclusion: Summarize the main stages of the process and draw conclusions based on the information presented.
To score well in Task Achievement/Task Response for process diagrams, it is important to ensure that you have fully answered the question and provided a clear and concise description of the process. Make sure that you have highlighted the main stages and key features of the process, and that you have used appropriate vocabulary and accurate information. Additionally, ensure that you have used a variety of sentence structures and linked your ideas coherently to achieve a smooth flow of information.
No Results Found
The page you requested could not be found. Try refining your search, or use the navigation above to locate the post.
IELTS Writting Task 1 Sample Essays
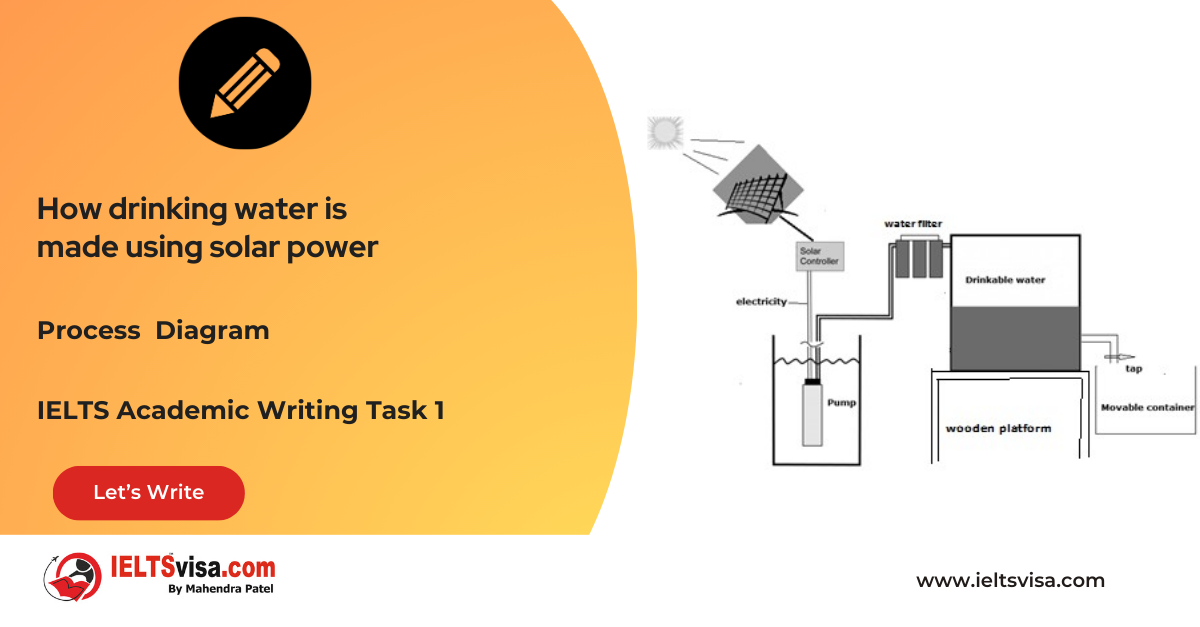
Task 1 – Process Diagram – How drinking water is made using solar power
20:00 Start Pause Stop [df_adh_heading title_infix="IELTS Writing Task 1 Question" use_divider="on" divider_color="#000000" divider_height="3px" divider_width="11%" _builder_version="4.27.0" _module_preset="default"...
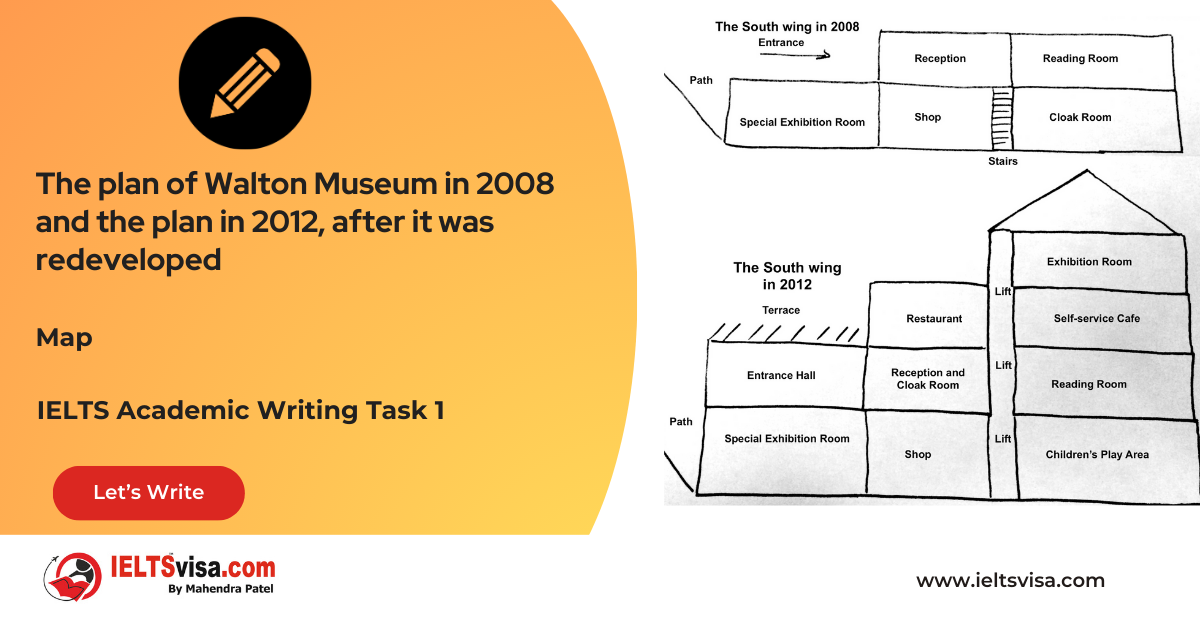
Task 1 – Maps – The plan of Walton Museum in 2008 and the plan in 2012, after it was redeveloped
20:00 Start Pause Stop [df_adh_heading title_infix="IELTS Writing Task 1 Question" use_divider="on" divider_color="#000000" divider_height="3px" divider_width="11%" _builder_version="4.27.0" _module_preset="default"...
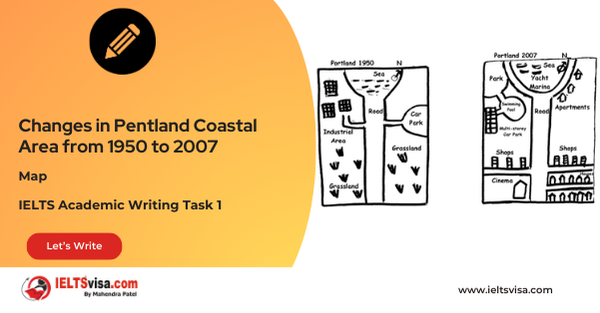
Task 1 – Map -Changes in Pentland Coastal Area from 1950 to 2007
The...
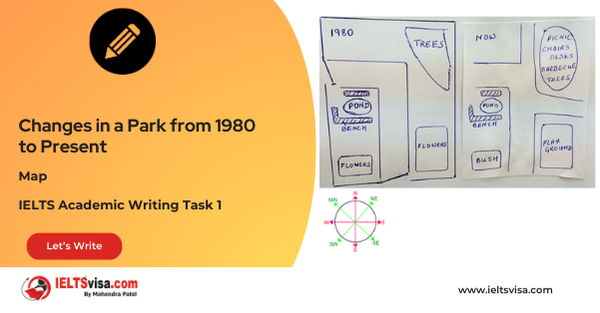
Task 1 – Map -Changes in a Park from 1980 to Present
The...
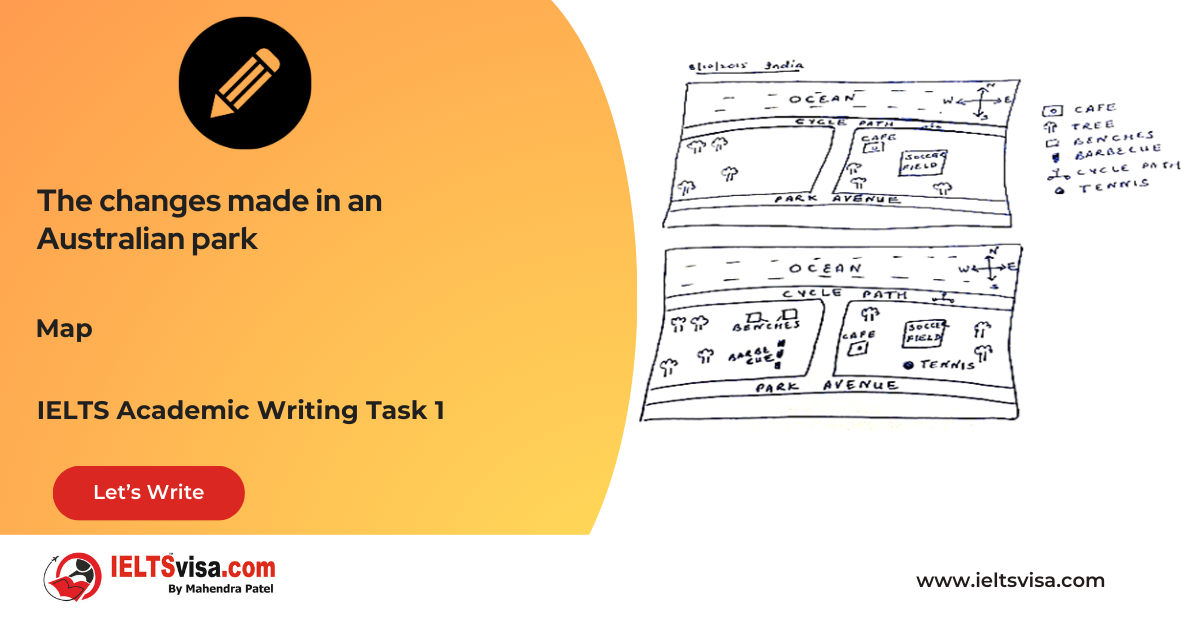
Task 1 – Maps – The changes made in an Australian park
20:00 Start Pause Stop [df_adh_heading title_infix="IELTS Writing Task 1 Question" use_divider="on" divider_color="#000000" divider_height="3px" divider_width="11%" _builder_version="4.27.0" _module_preset="default"...


