IELTS Academic Writing Task 1- Task Achievement/Task Response:
Charts, Graphs, Tables
In Academic Writing Task 1 of the IELTS exam, you will be given a chart, graph, table or diagram and asked to describe and summarize the information in your own words. The task requires you to:
- Analyze the information presented: Carefully examine the chart/graph/table/diagram and understand the main features, trends, and patterns.
- Identify the key points: Determine the most important information that needs to be conveyed in your response.
- Organize your writing: Plan how you will present the information in a logical and clear manner. This could involve grouping related data, comparing and contrasting different aspects of the information, and using appropriate vocabulary to describe trends.
- Write a clear and concise response: Use correct grammar, spelling and punctuation, and stay within the word count limits. Ensure that you have addressed all parts of the question and that your response is relevant to the task.
To achieve a high score in Task Achievement/Task Response, make sure you have fully answered the question asked and provided all the required information. Your response should be well-organized and easy to follow, with accurate use of data and appropriate vocabulary. Additionally, ensure that you have used a variety of sentence structures and linked your ideas coherently to achieve a smooth flow of information.
Process Diagrams
In Academic Writing Task 1 of the IELTS exam, you may also be presented with a process diagram, which shows a sequence of steps or stages involved in a particular process. To achieve high marks in Task Achievement/Task Response, you should:
- Analyze the process: Study the diagram carefully to understand the different stages involved in the process, and identify the key features and components.
- Plan your writing: Plan how you will present the information in a logical and clear manner, highlighting the most important stages of the process.
- Write an overview: Write an introduction that provides an overview of the process and the purpose of the process.
- Describe the process: Use a variety of sentence structures to describe the process in detail, using appropriate vocabulary and accurate information. Your description should be well-organized and easy to follow.
- Write a conclusion: Summarize the main stages of the process and draw conclusions based on the information presented.
To score well in Task Achievement/Task Response for process diagrams, it is important to ensure that you have fully answered the question and provided a clear and concise description of the process. Make sure that you have highlighted the main stages and key features of the process, and that you have used appropriate vocabulary and accurate information. Additionally, ensure that you have used a variety of sentence structures and linked your ideas coherently to achieve a smooth flow of information.

ACADEMIC WRITING TASK 1 – Time Management
ACADEMIC WRITING TASK 1: Time Management Time management is essential when completing the Academic Writing Task 1 of the IELTS exam, especially when dealing with charts, graphs, and tables. Here are some tips to help manage your time effectively: Plan your...

IELTS Academic Writing Task 1 – Lexical Resource & Grammatical Range and Accuracy
IELTS Academic Writing Task 1 - Lexical Resource & Grammatical Range and Accuracy In IELTS Academic Writing Task 1, two important criteria that are assessed are lexical resource and grammatical range and accuracy. Lexical Resource: This refers to your...
IELTS Academic Writing Task 1 – How to select key information, rather than describing everything
IELTS Academic Writing Task 1 - How to select key information, rather than describing everything. In IELTS Academic Writing Task 1, it is important to select and present the key information in an organized and coherent way, rather than describing everything...
IELTS Academic Writing Task 1 – Six Types
IELTS Academic Writing Task 1 - What the six types of questions are In IELTS Academic Writing Task 1, there are six types of questions that can be asked. These are: Line Graphs: A line graph displays changes in data over time. You will be asked to describe and...
How to receive a good score Academic Writing Task 1
How to receive a good score Academic Writing Task 1 To receive a good score in Academic Writing Task 1 of the IELTS exam, you should focus on the following: Task Achievement: Ensure that you have fully addressed the question prompt and provided a clear and concise...
IELTS Writting Task 1 Sample Essays
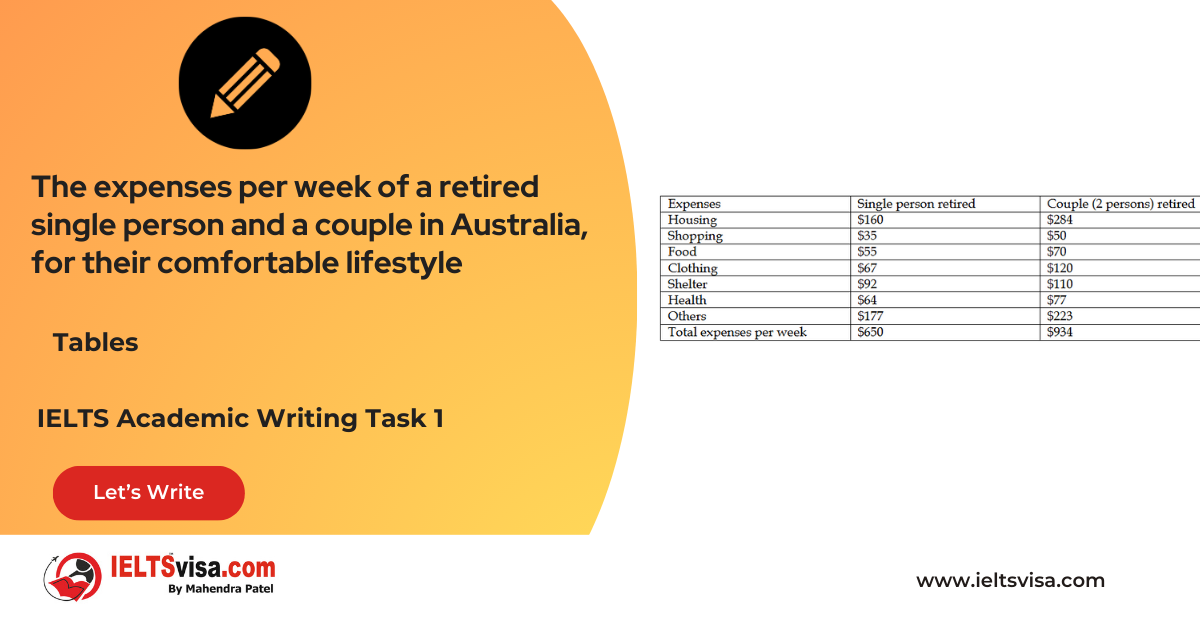
Task 1 – Tables – The expenses per week of a retired single person and a couple in Australia, for their comfortable lifestyle
20:00 Start Pause Stop [df_adh_heading title_infix="IELTS Writing Task 1 Question" use_divider="on" divider_color="#000000" divider_height="3px" divider_width="11%" _builder_version="4.27.0" _module_preset="default"...
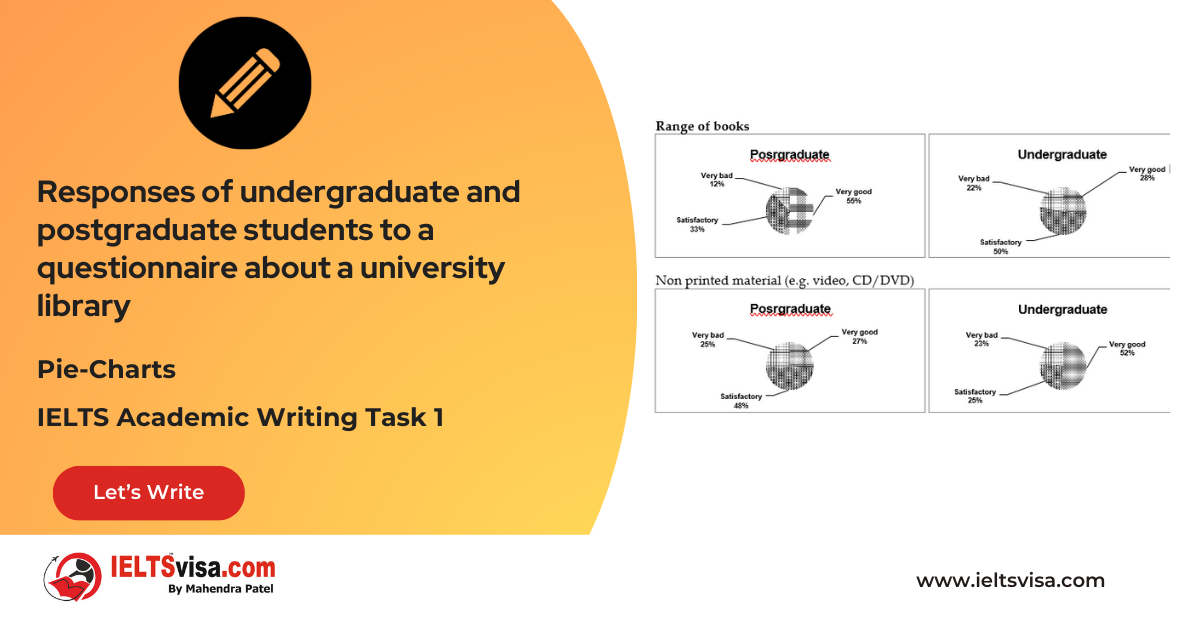
Task 1 – Pie-Charts – Responses of undergraduate and postgraduate students to a questionnaire about a university library
20:00 Start Pause Stop [df_adh_heading title_infix="IELTS Writing Task 1 Question" use_divider="on" divider_color="#000000" divider_height="3px" divider_width="11%" _builder_version="4.27.0" _module_preset="default" hover_enabled="0"...
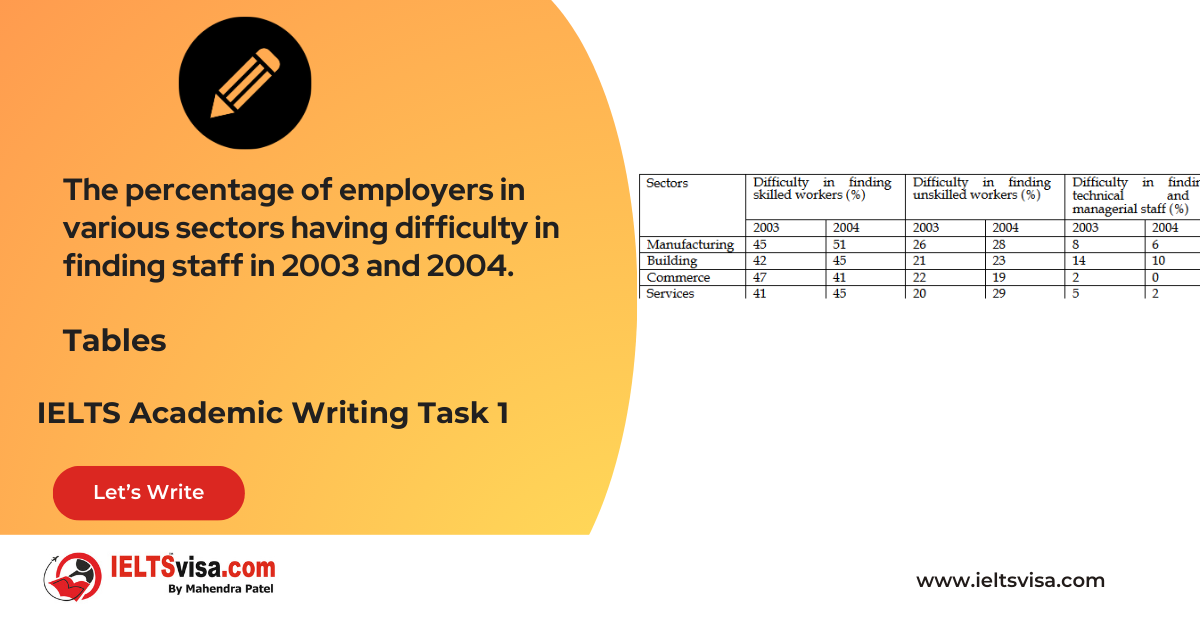
Task 1 – Table – The percentage of employers in various sectors having difficulty in finding staff in 2003 and 2004
20:00 Start Pause Stop [df_adh_heading title_infix="IELTS Writing Task 1 Question" use_divider="on" divider_color="#000000" divider_height="3px" divider_width="11%" _builder_version="4.27.0" _module_preset="default"...
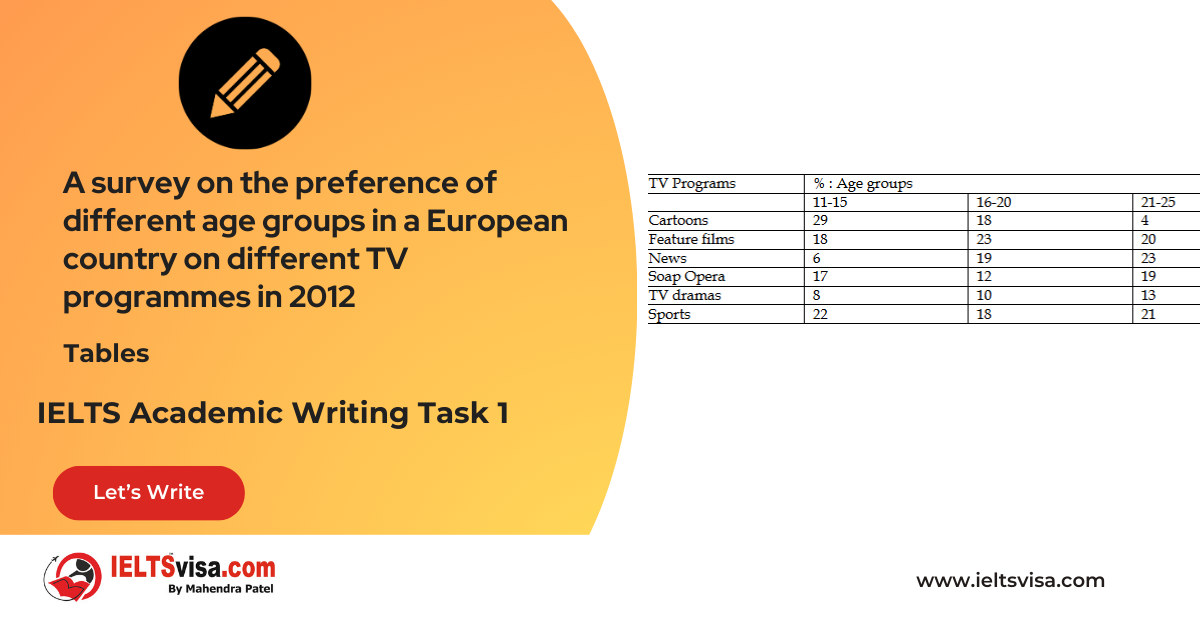
Task 1 – Table – A survey on the preference of different age groups in a European country on different TV programmers in 2012
20:00 Start Pause Stop [df_adh_heading title_infix="IELTS Writing Task 1 Question" use_divider="on" divider_color="#000000" divider_height="3px" divider_width="11%" _builder_version="4.27.0" _module_preset="default"...
Task 1 – Column Graphs – Bar Graph – Average Retirement Age for Men and Women in 2004 and 2008 in six different countries
The chart...


