ACADEMIC WRITING TASK 1: Time Management
Time management is essential when completing the Academic Writing Task 1 of the IELTS exam, especially when dealing with charts, graphs, and tables. Here are some tips to help manage your time effectively:
- Plan your writing: Spend 5-10 minutes analyzing the chart or graph, identifying the key features and trends, and planning your report. This will help you organize your writing and save time later.
- Use the given time wisely: You have 20 minutes to complete Task 1, so use the time wisely. Focus on the key features and trends, and avoid getting bogged down in too much detail.
- Write efficiently: Write concisely and clearly, using simple sentences and appropriate vocabulary. Use bullet points or tables to organize your data, which can save time and make your report easier to read.
- Check your work: Allow 2-3 minutes at the end to check your work for errors in grammar, spelling, and punctuation.
- Practice: Practicing writing Task 1 under timed conditions can help you become more efficient and confident in your writing, allowing you to better manage your time on exam day.
Remember, the key to effective time management is to stay focused and organized, and to prioritize the most important information. With practice and proper planning, you can complete the Academic Writing Task 1 within the given time limit and achieve a high score.
No Results Found
The page you requested could not be found. Try refining your search, or use the navigation above to locate the post.
IELTS Writting Task 1 Sample Essays
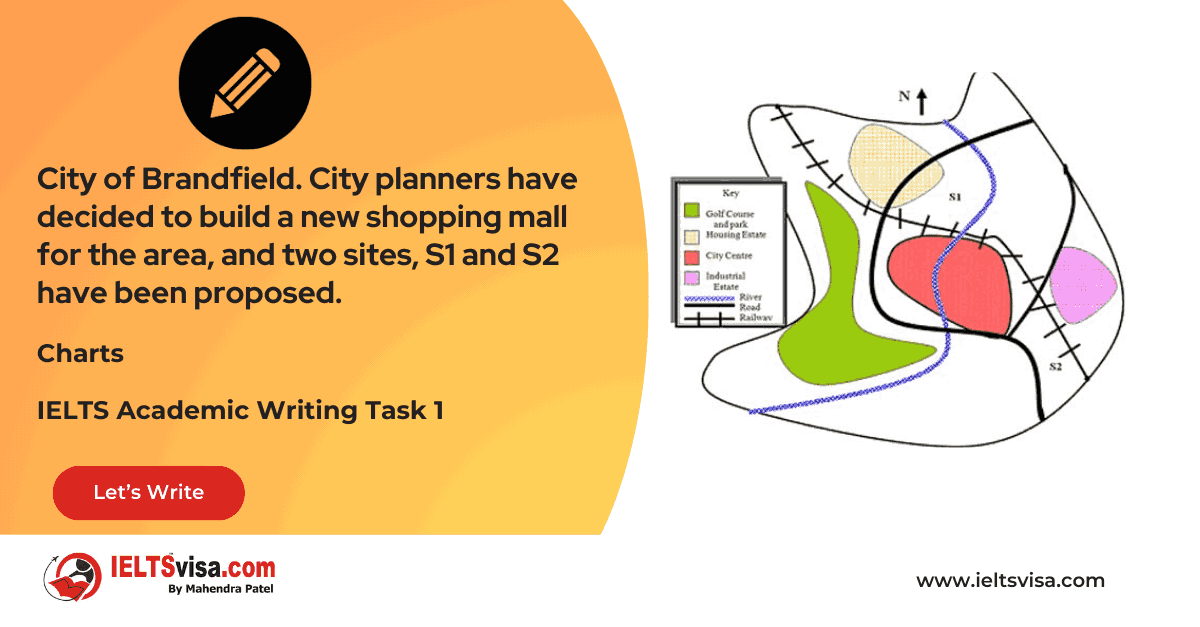
Task 1 – Table – City of Brandfield. City planners have decided to build a new shopping mall for the area, and two sites, S1 and S2 have been proposed.
20:00 Start Pause Stop [df_adh_heading title_infix="IELTS Writing Task 1 Question" use_divider="on" divider_color="#000000" divider_height="3px" divider_width="11%" _builder_version="4.27.0" _module_preset="default"...
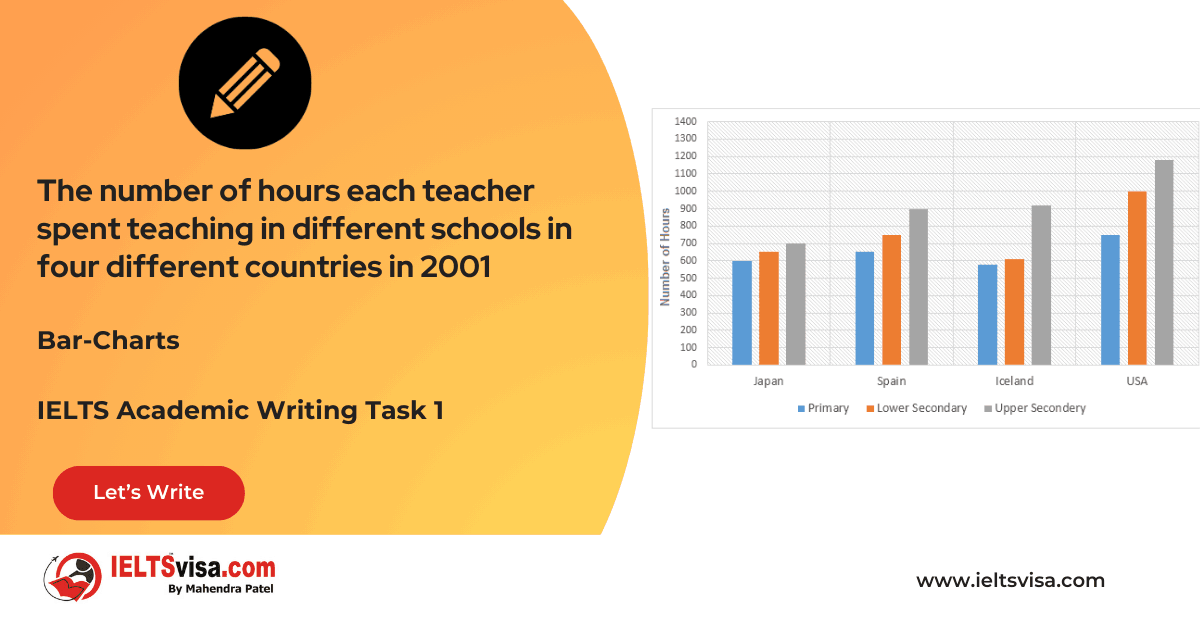
Task 1 – Bar Chart -The number of hours each teacher spent teaching in different schools in four different countries in 2001
20:00 Start Pause Stop [df_adh_heading title_infix="IELTS Writing Task 1 Question" use_divider="on" divider_color="#000000" divider_height="3px" divider_width="11%" _builder_version="4.27.0" _module_preset="default"...
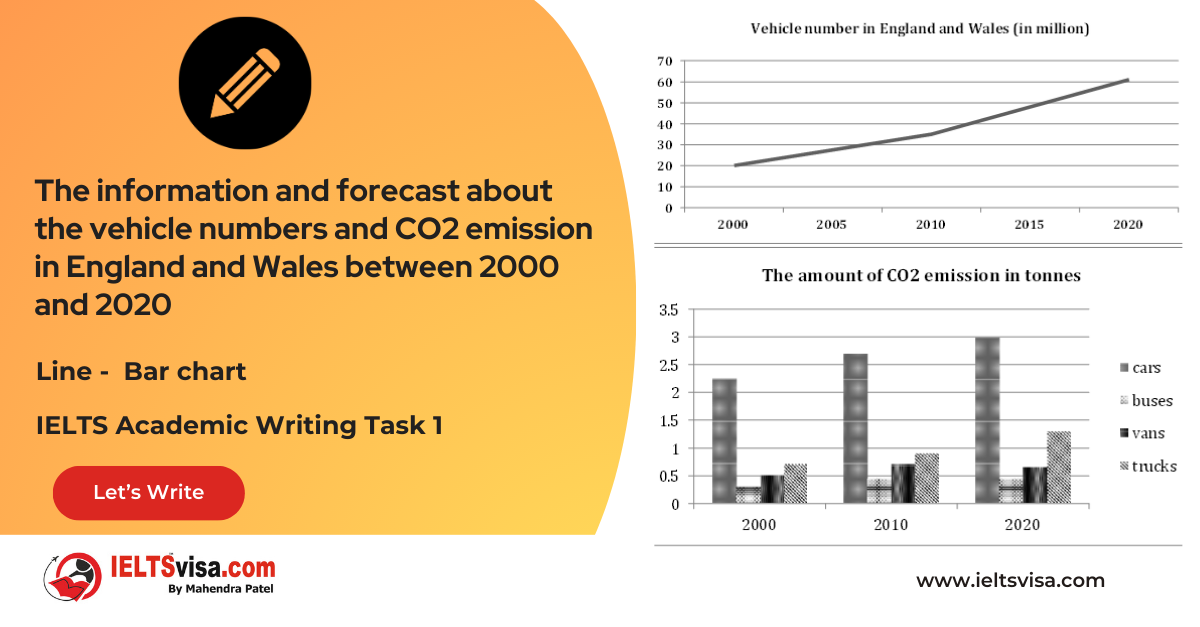
Task 1 – Line Graph – The information and forecast about the vehicle numbers and CO2 emission in England and Wales between 2000 and 2020
20:00 Start Pause Stop [df_adh_heading title_infix="IELTS Writing Task 1 Question" use_divider="on" divider_color="#000000" divider_height="3px" divider_width="11%" _builder_version="4.27.0" _module_preset="default"...
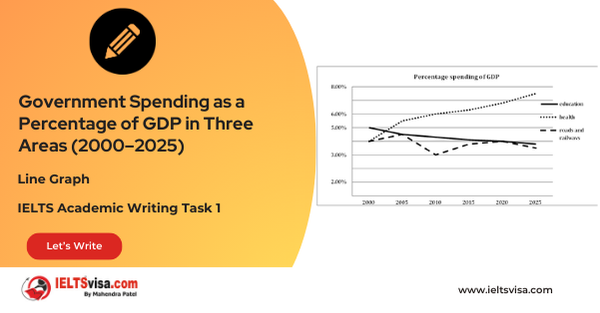
Task 1 – Line graph -Government Spending as a Percentage of GDP in Three Areas (2000–2025)
The given...
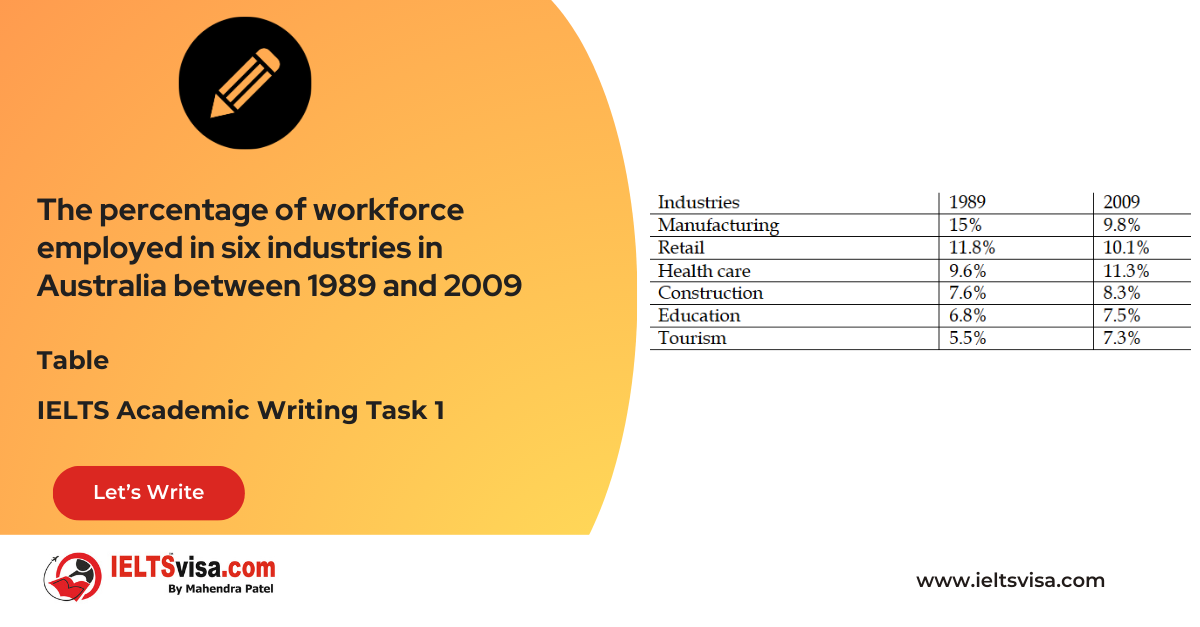
Task 1 – Tables – The percentage of workforce employed in six industries in Australia between 1989 and 2009
20:00 Start Pause Stop [df_adh_heading title_infix="IELTS Writing Task 1 Question" use_divider="on" divider_color="#000000" divider_height="3px" divider_width="11%" _builder_version="4.27.0" _module_preset="default"...


