ACADEMIC WRITING TASK 1: Time Management
Time management is essential when completing the Academic Writing Task 1 of the IELTS exam, especially when dealing with charts, graphs, and tables. Here are some tips to help manage your time effectively:
- Plan your writing: Spend 5-10 minutes analyzing the chart or graph, identifying the key features and trends, and planning your report. This will help you organize your writing and save time later.
- Use the given time wisely: You have 20 minutes to complete Task 1, so use the time wisely. Focus on the key features and trends, and avoid getting bogged down in too much detail.
- Write efficiently: Write concisely and clearly, using simple sentences and appropriate vocabulary. Use bullet points or tables to organize your data, which can save time and make your report easier to read.
- Check your work: Allow 2-3 minutes at the end to check your work for errors in grammar, spelling, and punctuation.
- Practice: Practicing writing Task 1 under timed conditions can help you become more efficient and confident in your writing, allowing you to better manage your time on exam day.
Remember, the key to effective time management is to stay focused and organized, and to prioritize the most important information. With practice and proper planning, you can complete the Academic Writing Task 1 within the given time limit and achieve a high score.
No Results Found
The page you requested could not be found. Try refining your search, or use the navigation above to locate the post.
IELTS Writting Task 1 Sample Essays
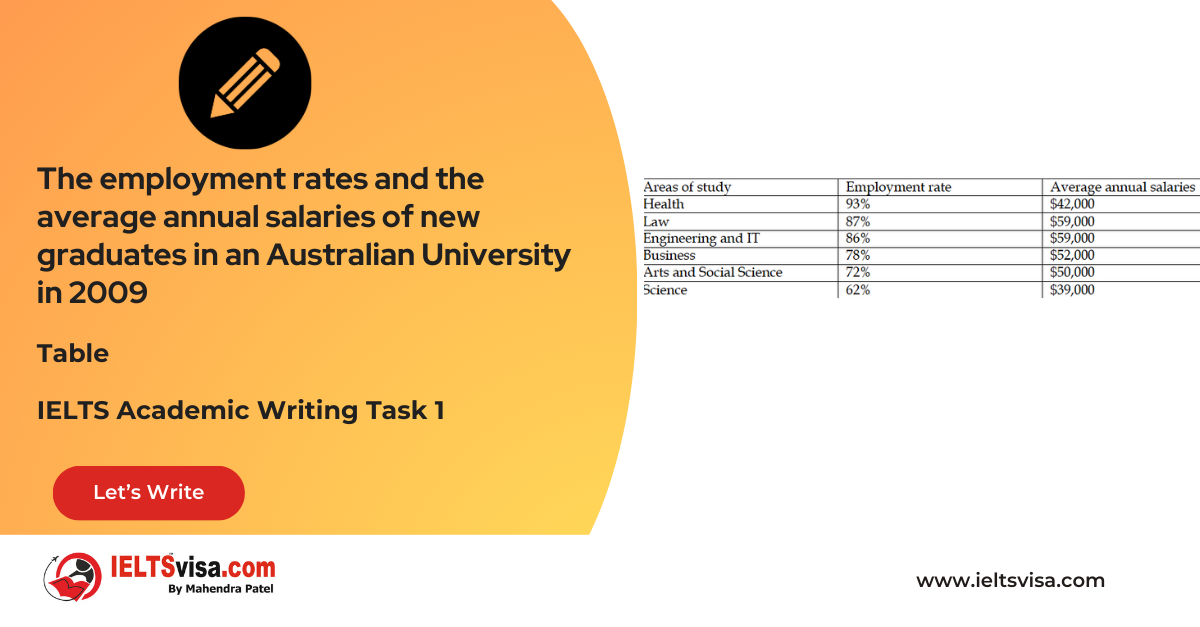
Task 1 – Tables – The employment rates and the average annual salaries of new graduates in an Australian University in 2009
20:00 Start Pause Stop [df_adh_heading title_infix="IELTS Writing Task 1 Question" use_divider="on" divider_color="#000000" divider_height="3px" divider_width="11%" _builder_version="4.27.0" _module_preset="default"...
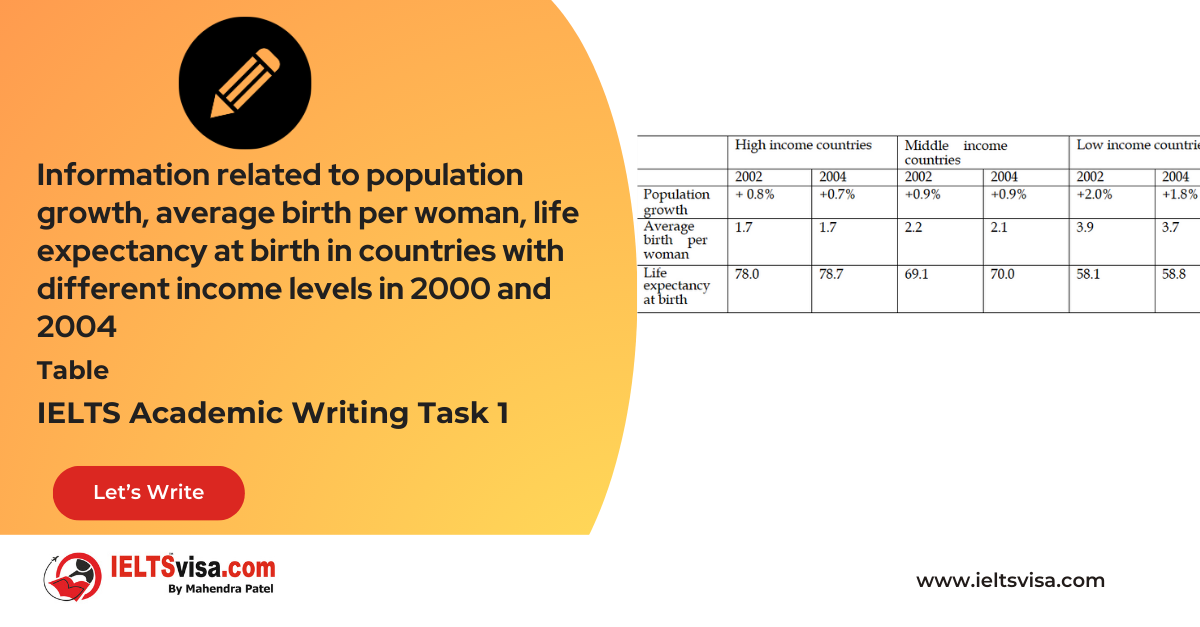
Task 1 – Tables – Information related to population growth, average birth per woman, life expectancy at birth in countries with different income levels in 2000 and 2004
20:00 Start Pause Stop [df_adh_heading title_infix="IELTS Writing Task 1 Question" use_divider="on" divider_color="#000000" divider_height="3px" divider_width="11%" _builder_version="4.27.0" _module_preset="default"...
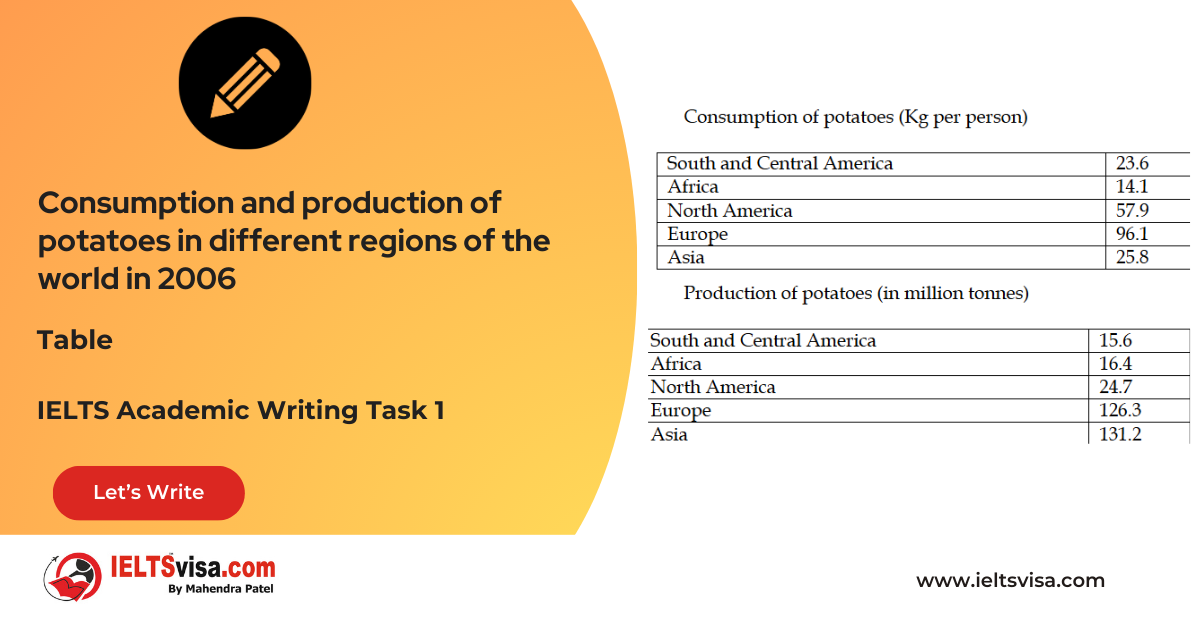
Task 1 – Tables – Consumption and production of potatoes in different regions of the world in 2006
20:00 Start Pause Stop [df_adh_heading title_infix="IELTS Writing Task 1 Question" use_divider="on" divider_color="#000000" divider_height="3px" divider_width="11%" _builder_version="4.27.0" _module_preset="default"...
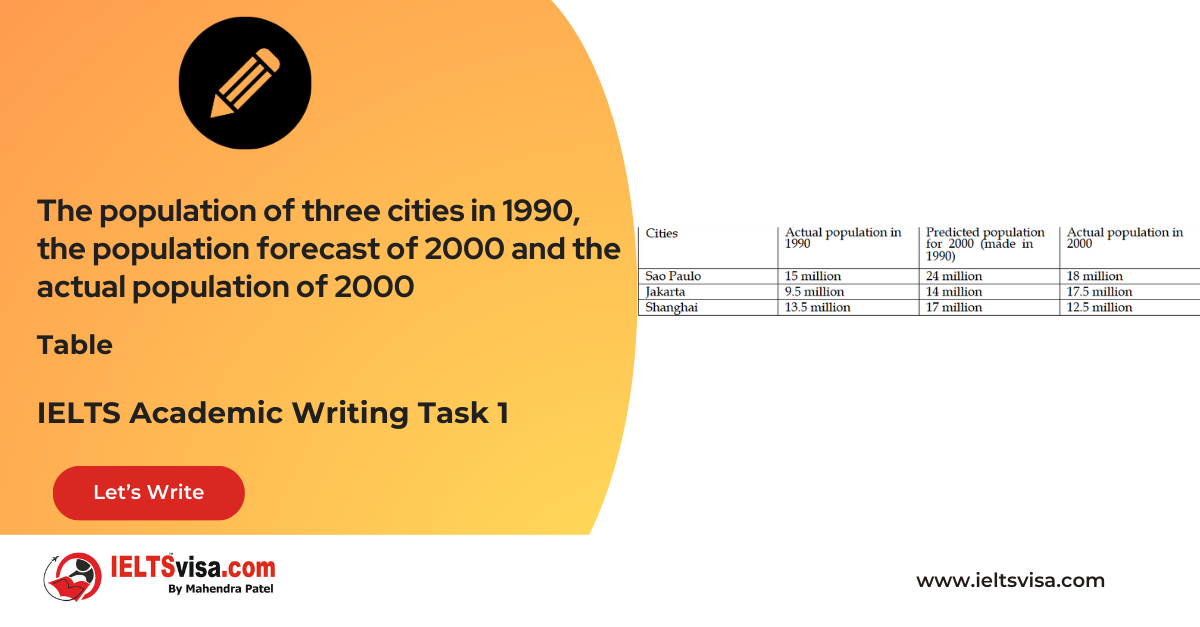
Task 1 – Tables – The population of three cities in 1990, the population forecast of 2000 and the actual population of 2000
20:00 Start Pause Stop [df_adh_heading title_infix="IELTS Writing Task 1 Question" use_divider="on" divider_color="#000000" divider_height="3px" divider_width="11%" _builder_version="4.27.0" _module_preset="default"...
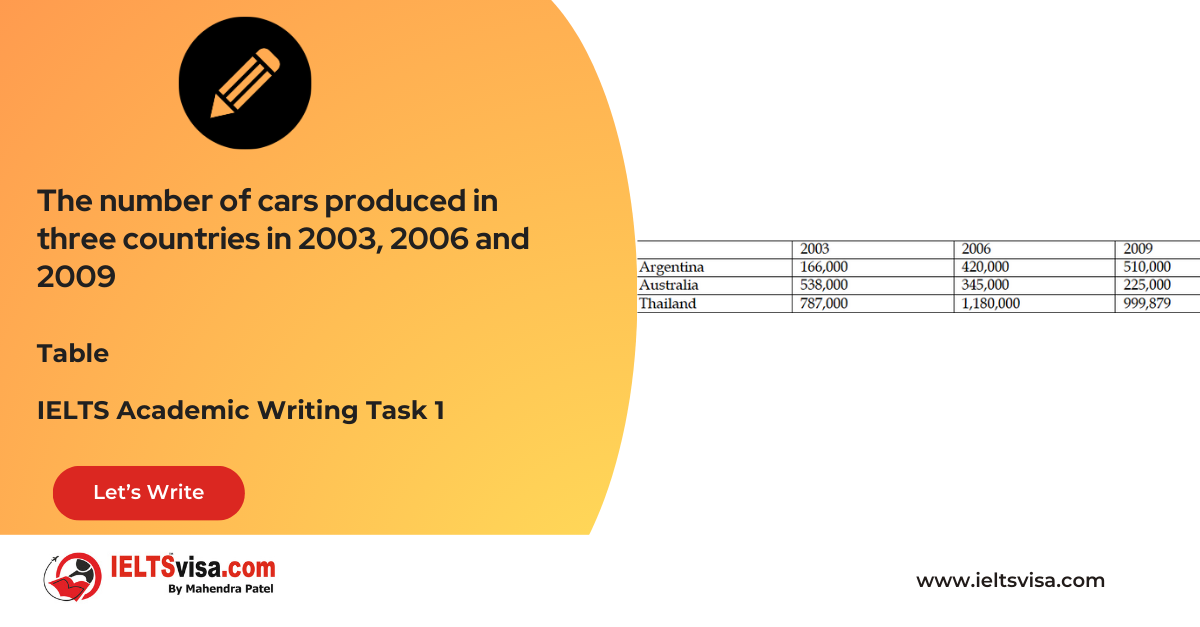
Task 1 – Tables – The number of cars produced in three countries in 2003, 2006 and 2009
20:00 Start Pause Stop [df_adh_heading title_infix="IELTS Writing Task 1 Question" use_divider="on" divider_color="#000000" divider_height="3px" divider_width="11%" _builder_version="4.27.0" _module_preset="default"...


