ACADEMIC WRITING TASK 1: Time Management
Time management is essential when completing the Academic Writing Task 1 of the IELTS exam, especially when dealing with charts, graphs, and tables. Here are some tips to help manage your time effectively:
- Plan your writing: Spend 5-10 minutes analyzing the chart or graph, identifying the key features and trends, and planning your report. This will help you organize your writing and save time later.
- Use the given time wisely: You have 20 minutes to complete Task 1, so use the time wisely. Focus on the key features and trends, and avoid getting bogged down in too much detail.
- Write efficiently: Write concisely and clearly, using simple sentences and appropriate vocabulary. Use bullet points or tables to organize your data, which can save time and make your report easier to read.
- Check your work: Allow 2-3 minutes at the end to check your work for errors in grammar, spelling, and punctuation.
- Practice: Practicing writing Task 1 under timed conditions can help you become more efficient and confident in your writing, allowing you to better manage your time on exam day.
Remember, the key to effective time management is to stay focused and organized, and to prioritize the most important information. With practice and proper planning, you can complete the Academic Writing Task 1 within the given time limit and achieve a high score.
No Results Found
The page you requested could not be found. Try refining your search, or use the navigation above to locate the post.
IELTS Writting Task 1 Sample Essays
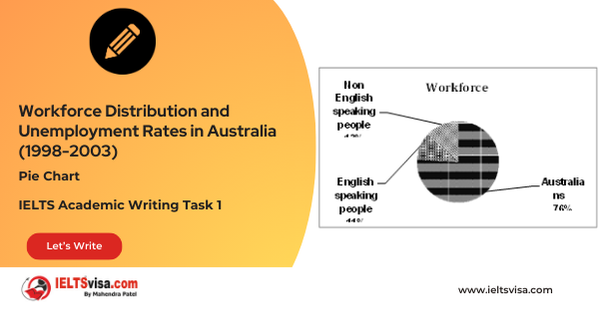
Task 1 – Pie Charts -Workforce Distribution and Unemployment Rates in Australia (1998-2003)
The...
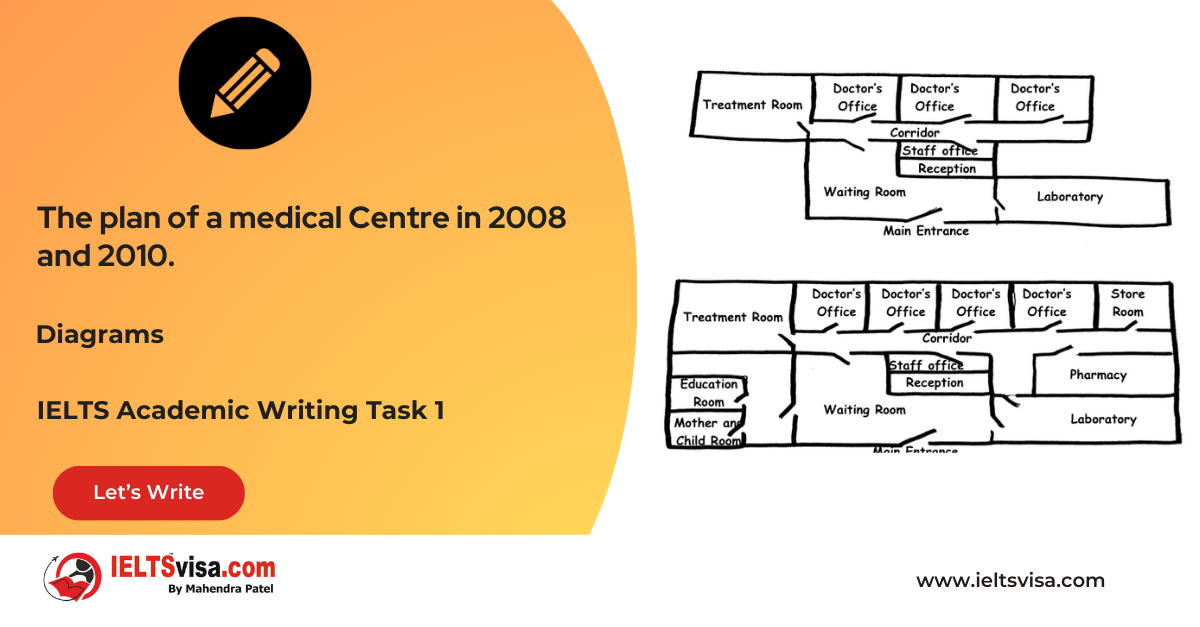
Task 1 – Diagrams -The plan of a medical Centre in 2008 and 2010.
20:00 Start Pause Stop [df_adh_heading title_infix="IELTS Writing Task 1 Question" use_divider="on" divider_color="#000000" divider_height="3px" divider_width="11%" _builder_version="4.27.0" _module_preset="default"...
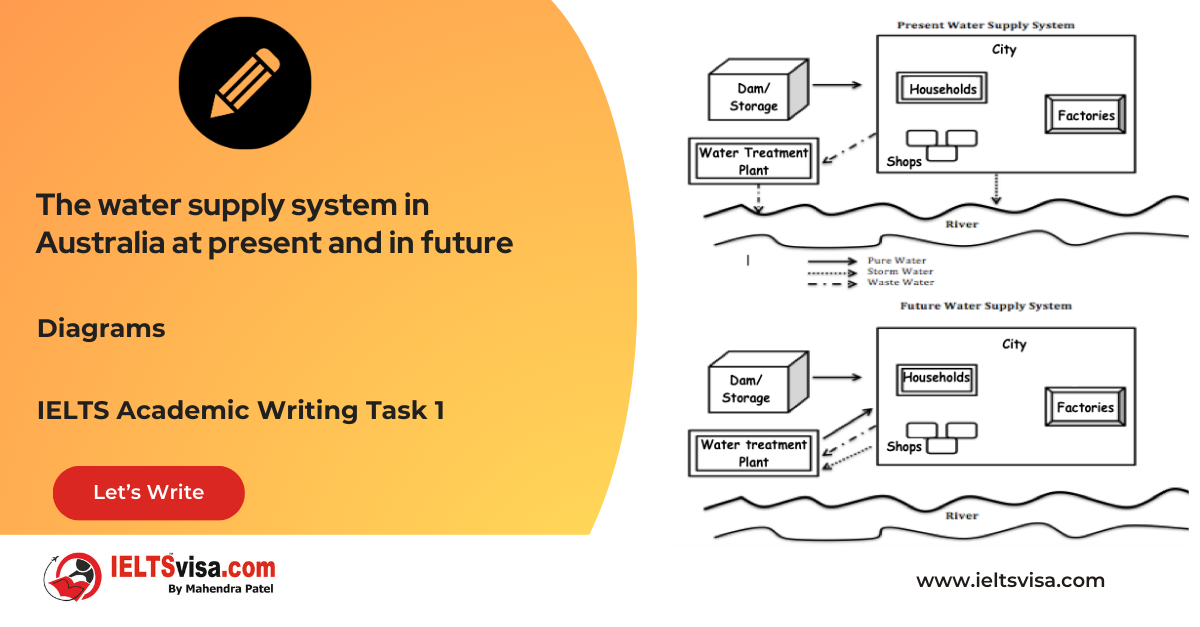
Task 1 – Diagrams -The water supply system in Australia at present and in future
20:00 Start Pause Stop [df_adh_heading title_infix="IELTS Writing Task 1 Question" use_divider="on" divider_color="#000000" divider_height="3px" divider_width="11%" _builder_version="4.27.0" _module_preset="default"...
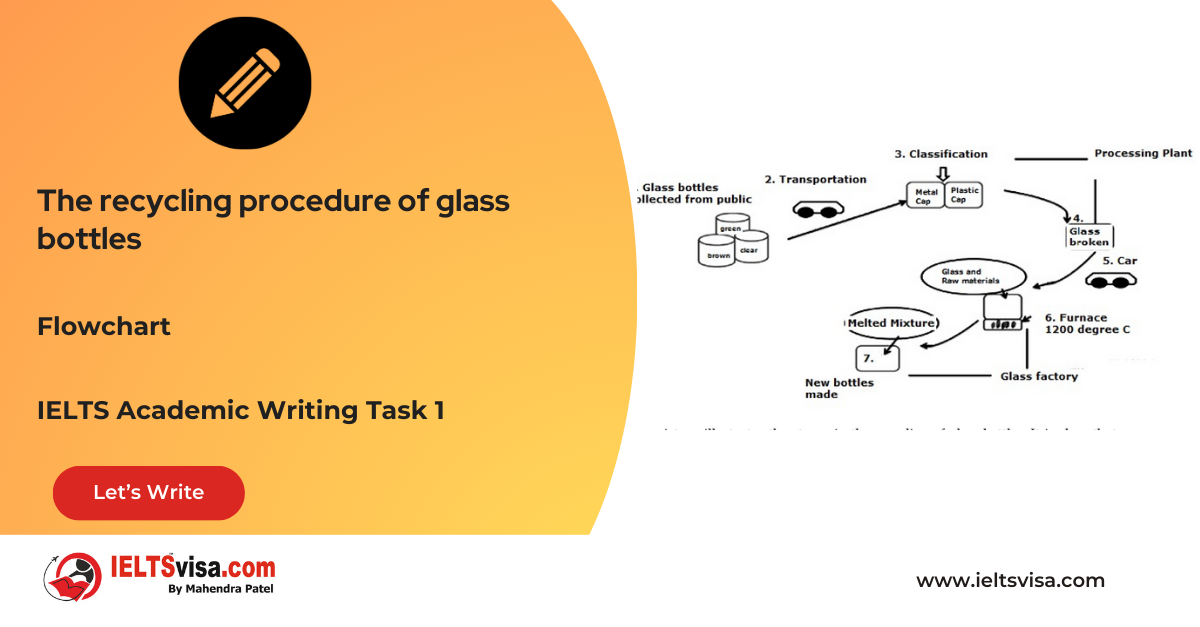
Task 1 – Process – The recycling procedure of glass bottles
20:00 Start Pause Stop [df_adh_heading title_infix="IELTS Writing Task 1 Question" use_divider="on" divider_color="#000000" divider_height="3px" divider_width="11%" _builder_version="4.27.0" _module_preset="default"...
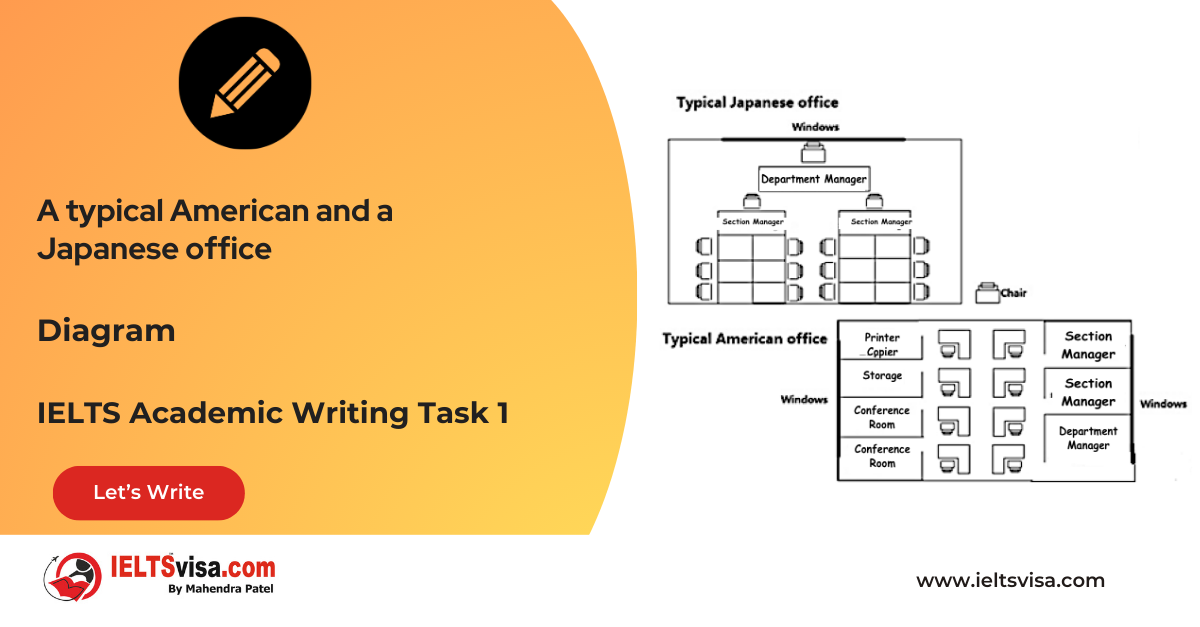
Task 1 – Diagram – A typical American and a Japanese office
20:00 Start Pause Stop [df_adh_heading title_infix="IELTS Writing Task 1 Question" use_divider="on" divider_color="#000000" divider_height="3px" divider_width="11%" _builder_version="4.27.0" _module_preset="default"...


