ACADEMIC WRITING TASK 1: Time Management
Time management is essential when completing the Academic Writing Task 1 of the IELTS exam, especially when dealing with charts, graphs, and tables. Here are some tips to help manage your time effectively:
- Plan your writing: Spend 5-10 minutes analyzing the chart or graph, identifying the key features and trends, and planning your report. This will help you organize your writing and save time later.
- Use the given time wisely: You have 20 minutes to complete Task 1, so use the time wisely. Focus on the key features and trends, and avoid getting bogged down in too much detail.
- Write efficiently: Write concisely and clearly, using simple sentences and appropriate vocabulary. Use bullet points or tables to organize your data, which can save time and make your report easier to read.
- Check your work: Allow 2-3 minutes at the end to check your work for errors in grammar, spelling, and punctuation.
- Practice: Practicing writing Task 1 under timed conditions can help you become more efficient and confident in your writing, allowing you to better manage your time on exam day.
Remember, the key to effective time management is to stay focused and organized, and to prioritize the most important information. With practice and proper planning, you can complete the Academic Writing Task 1 within the given time limit and achieve a high score.
No Results Found
The page you requested could not be found. Try refining your search, or use the navigation above to locate the post.
IELTS Writting Task 1 Sample Essays
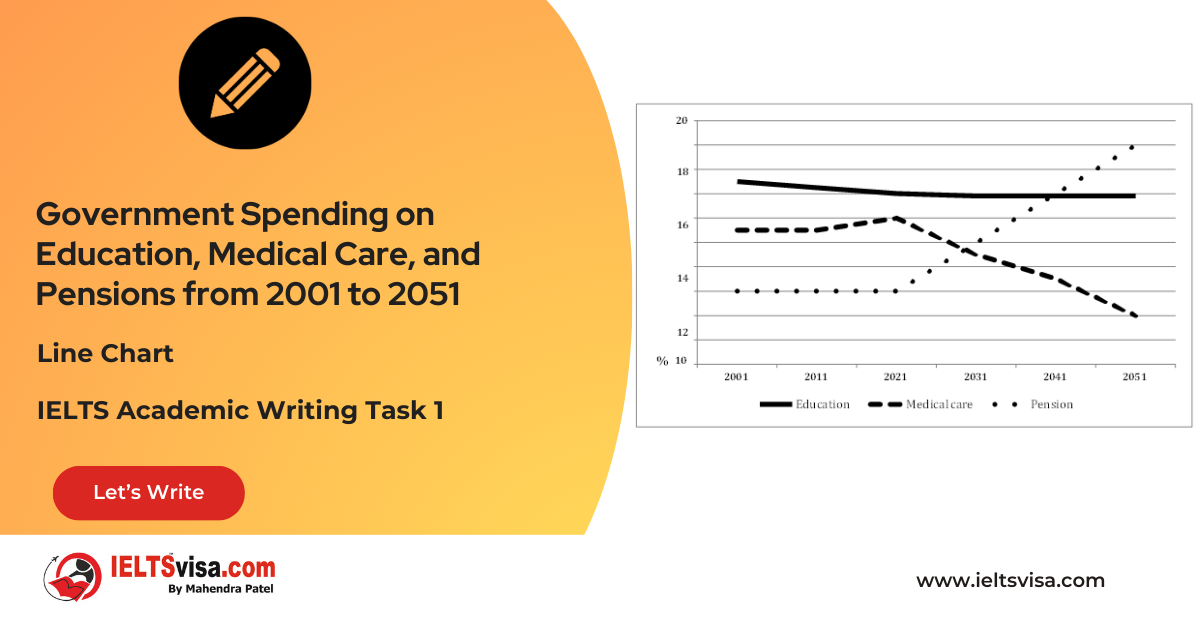
Task 1 – Line Chart -Government Spending on Education, Medical Care, and Pensions from 2001 to 2051
The graph...
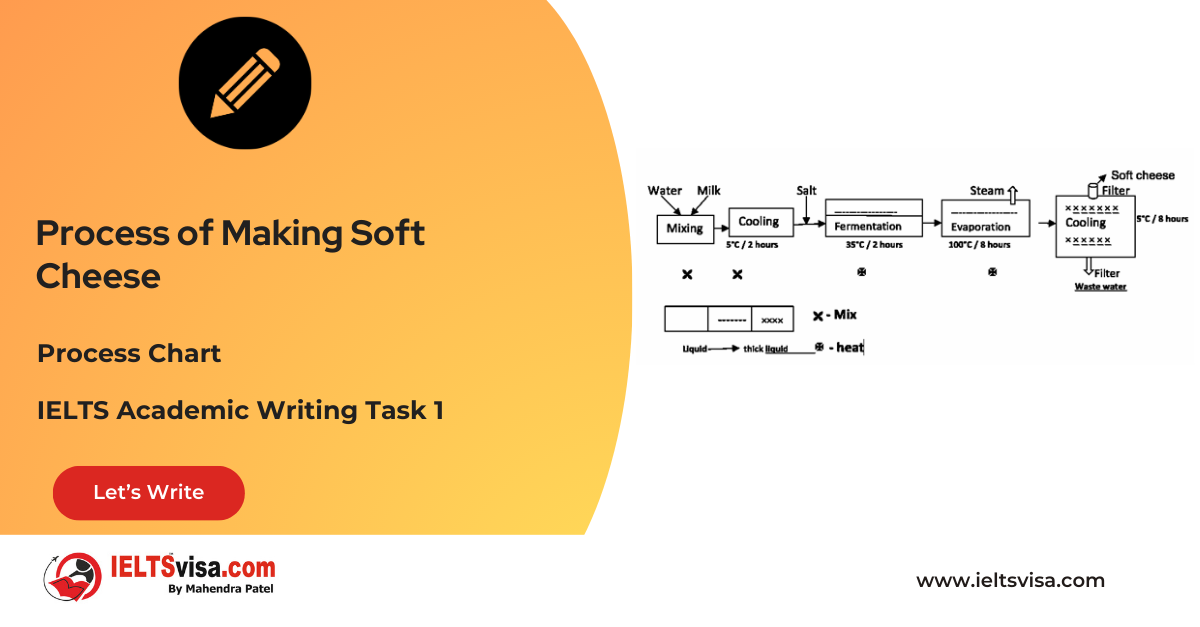
Task 1 – Process Chart -Process of Making Soft Cheese
The...
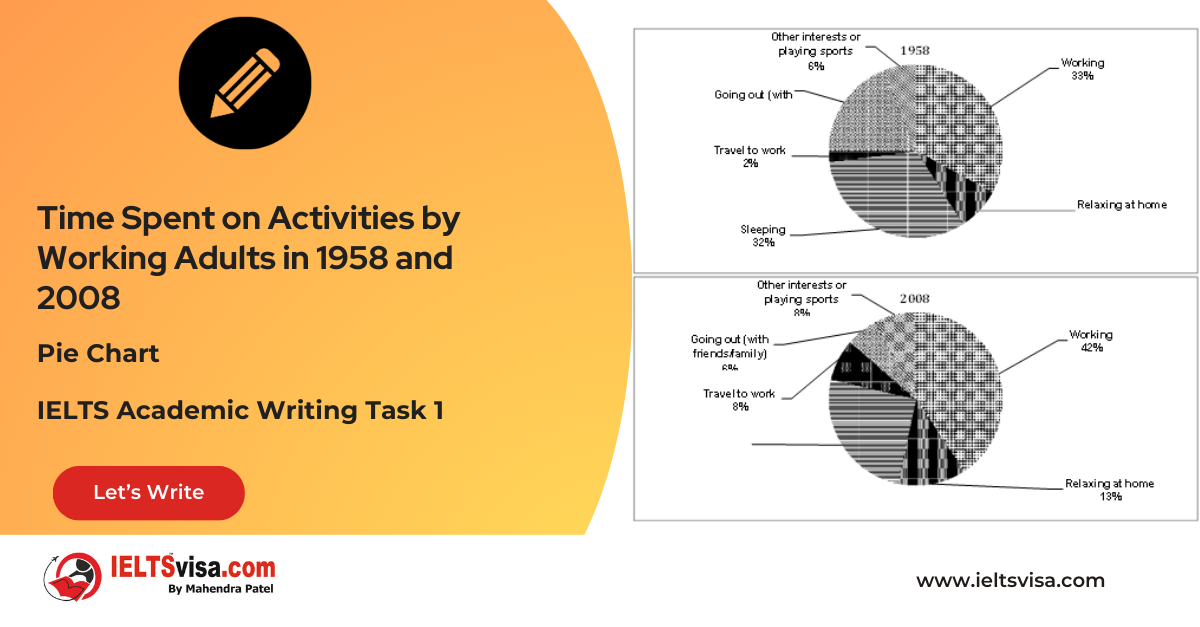
Task 1 – Pie Chart – Time Spent on Activities by Working Adults in 1958 and 2008
The charts...
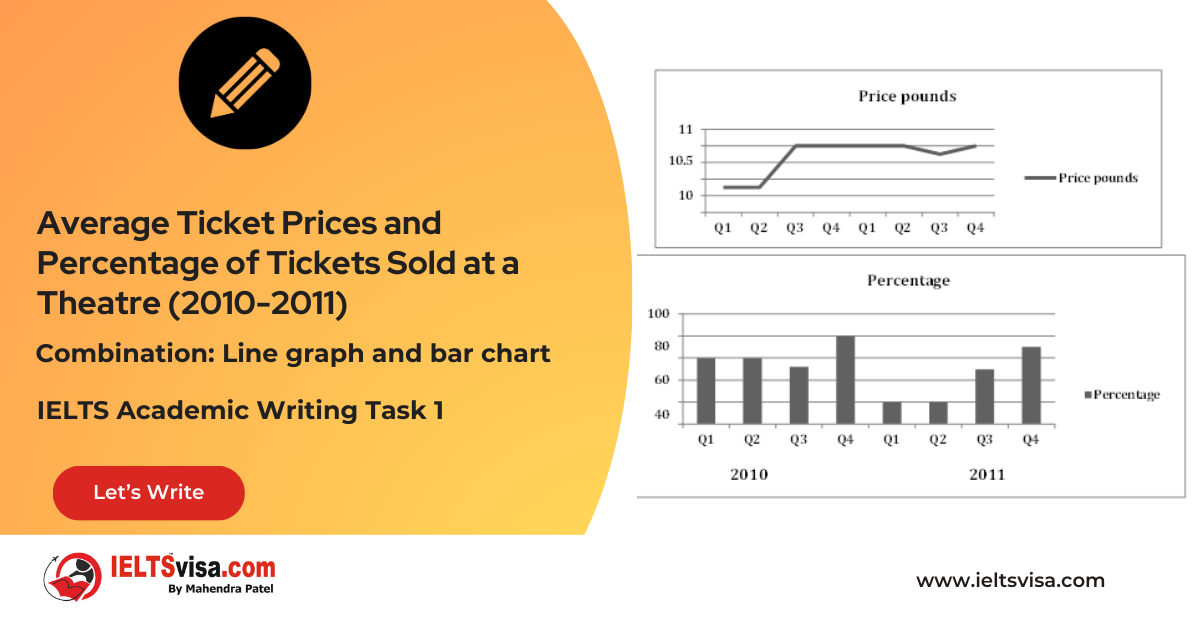
Task 1 – Combination: Line graph and bar chart- Average Ticket Prices and Percentage of Tickets Sold at a Theatre (2010-2011)
The line...
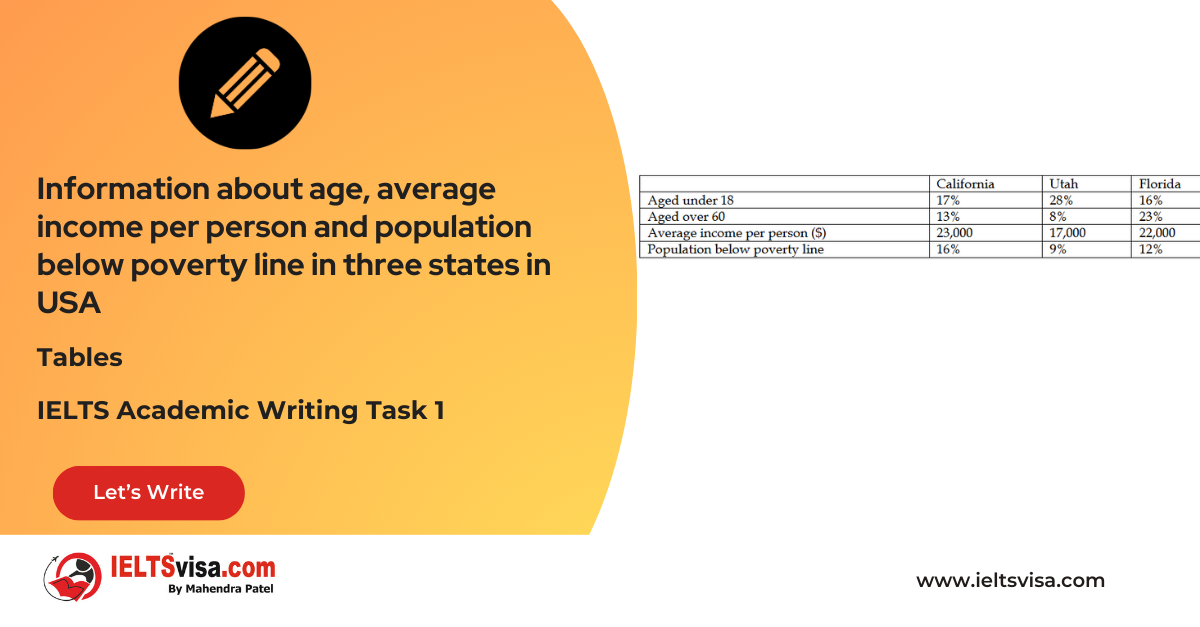
Task 1 – Table- Information about age, average income per person and population below poverty line in three states in USA
20:00 Start Pause Stop [df_adh_heading title_infix="IELTS Writing Task 1 Question" use_divider="on" divider_color="#000000" divider_height="3px" divider_width="11%" _builder_version="4.27.0" _module_preset="default"...


