ACADEMIC WRITING TASK 1: Time Management
Time management is essential when completing the Academic Writing Task 1 of the IELTS exam, especially when dealing with charts, graphs, and tables. Here are some tips to help manage your time effectively:
- Plan your writing: Spend 5-10 minutes analyzing the chart or graph, identifying the key features and trends, and planning your report. This will help you organize your writing and save time later.
- Use the given time wisely: You have 20 minutes to complete Task 1, so use the time wisely. Focus on the key features and trends, and avoid getting bogged down in too much detail.
- Write efficiently: Write concisely and clearly, using simple sentences and appropriate vocabulary. Use bullet points or tables to organize your data, which can save time and make your report easier to read.
- Check your work: Allow 2-3 minutes at the end to check your work for errors in grammar, spelling, and punctuation.
- Practice: Practicing writing Task 1 under timed conditions can help you become more efficient and confident in your writing, allowing you to better manage your time on exam day.
Remember, the key to effective time management is to stay focused and organized, and to prioritize the most important information. With practice and proper planning, you can complete the Academic Writing Task 1 within the given time limit and achieve a high score.

Understand why we do not write a conclusion for Academic Writing Task 1
IELTS Academic Writing task 1 Understand why we do not write a conclusion for Academic Writing Task 1 In IELTS Academic Writing Task 1, the candidate is required to write a report based on the data presented in a graph, table, chart, or diagram. The purpose of...
IEL TS Writing Scores
IEL TS Writing Scores IELTS Writing scores range from 0 to 9, with 0.5 band increments. The score you receive for the Writing section is based on the following criteria: Task Achievement (Task Response): This measures how well you address the task, and if you...
IELTS Writting Task 1 Sample Essays
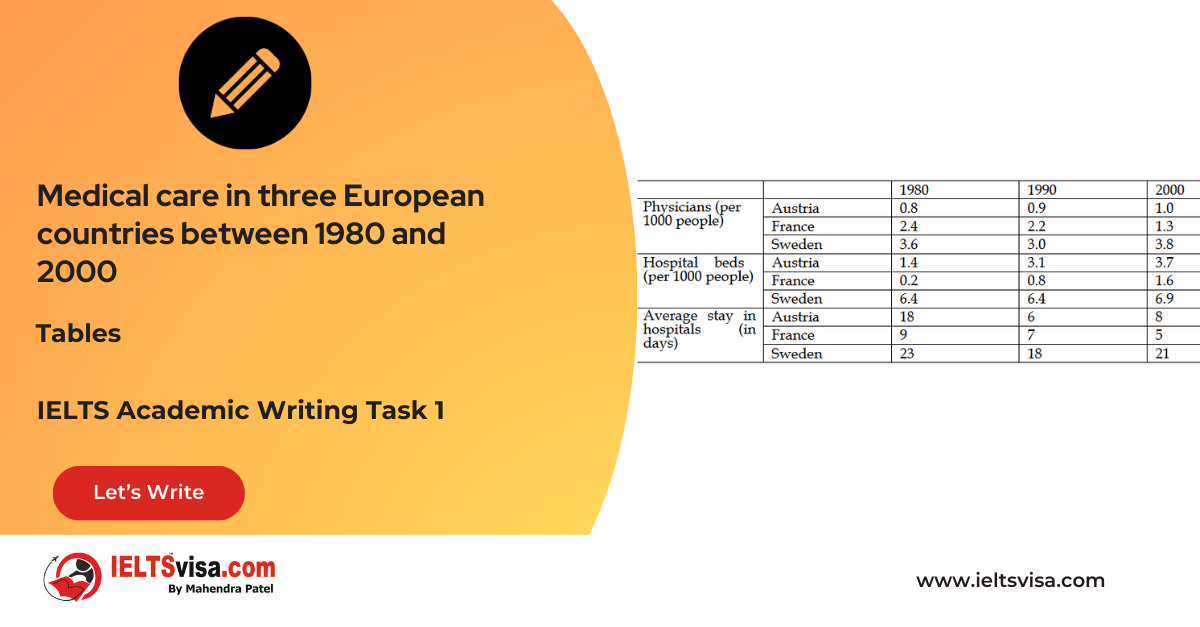
Task 1 – Table – The information about medical care in three European countries between 1980 and 2000
20:00 Start Pause Stop [df_adh_heading title_infix="IELTS Writing Task 1 Question" use_divider="on" divider_color="#000000" divider_height="3px" divider_width="11%" _builder_version="4.27.0" _module_preset="default" hover_enabled="0"...
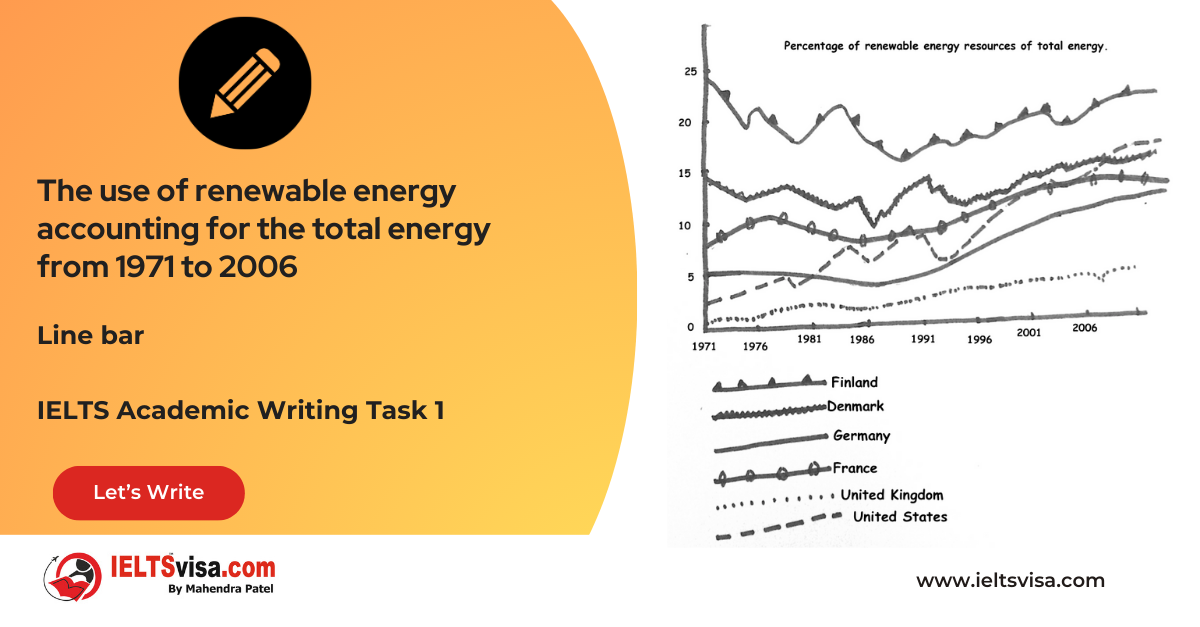
Task 1 – Line bar – The use of renewable energy accounting for the total energy from 1971 to 2006
20:00 Start Pause Stop [df_adh_heading title_infix="IELTS Writing Task 1 Question" use_divider="on" divider_color="#000000" divider_height="3px" divider_width="11%" _builder_version="4.27.0" _module_preset="default" hover_enabled="0"...
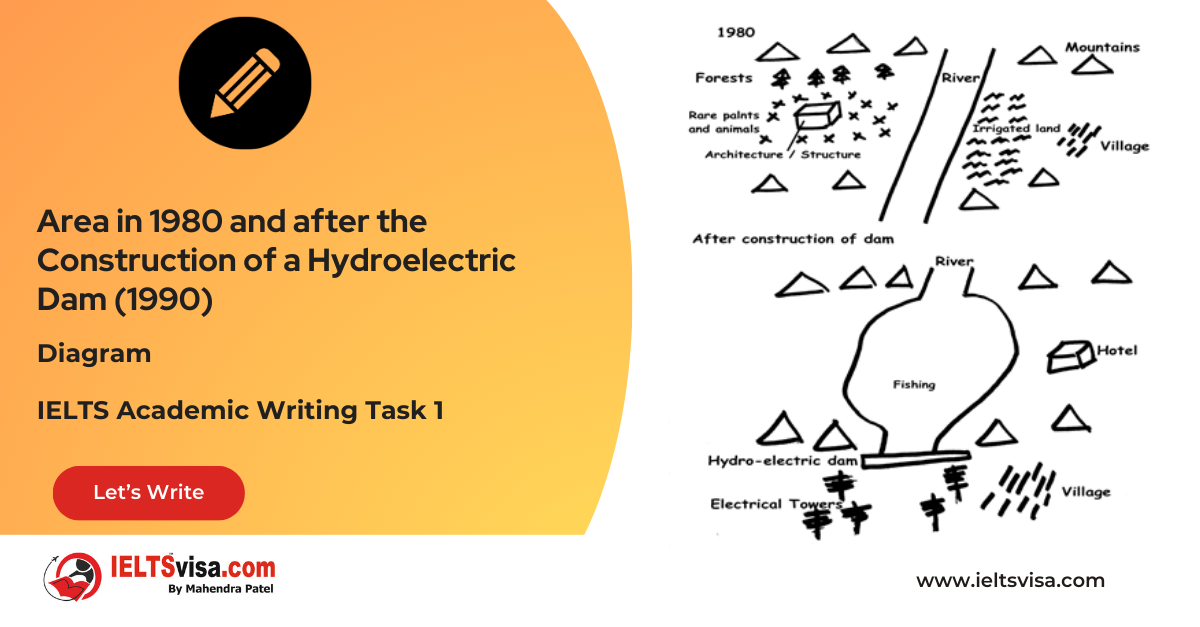
Task 1 – Diagram – Area in 1980 and after the Construction of a Hydroelectric Dam (1990)
[df_adh_heading title_infix="IELTS Writing Task 1 Question" use_divider="on" divider_color="#000000" divider_height="3px" divider_width="11%" _builder_version="4.27.0" _module_preset="default" hover_enabled="0" global_colors_info="{}"...
Task 1 – Line Graph – Number of Four Fish Species (1982–2007)
[df_adh_heading title_infix="IELTS Writing Task 1 Question" use_divider="on" divider_color="#000000" divider_height="3px" divider_width="11%" _builder_version="4.27.0" _module_preset="default" hover_enabled="0" global_colors_info="{}"...
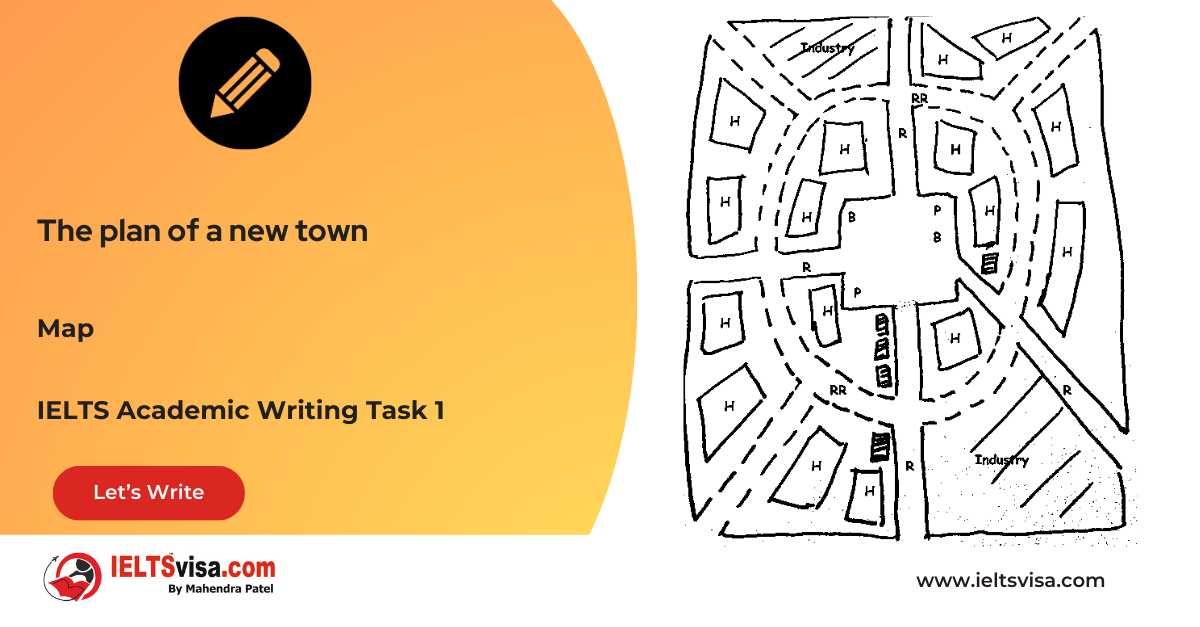
Task 1 – Map – The plan of a new town
20:00 Start Pause Stop [df_adh_heading title_infix="IELTS Writing Task 1 Question" use_divider="on" divider_color="#000000" divider_height="3px" divider_width="11%" _builder_version="4.27.0" _module_preset="default" t_infix_font="|700|||||||"...


