ACADEMIC WRITING TASK 1: Time Management
Time management is essential when completing the Academic Writing Task 1 of the IELTS exam, especially when dealing with charts, graphs, and tables. Here are some tips to help manage your time effectively:
- Plan your writing: Spend 5-10 minutes analyzing the chart or graph, identifying the key features and trends, and planning your report. This will help you organize your writing and save time later.
- Use the given time wisely: You have 20 minutes to complete Task 1, so use the time wisely. Focus on the key features and trends, and avoid getting bogged down in too much detail.
- Write efficiently: Write concisely and clearly, using simple sentences and appropriate vocabulary. Use bullet points or tables to organize your data, which can save time and make your report easier to read.
- Check your work: Allow 2-3 minutes at the end to check your work for errors in grammar, spelling, and punctuation.
- Practice: Practicing writing Task 1 under timed conditions can help you become more efficient and confident in your writing, allowing you to better manage your time on exam day.
Remember, the key to effective time management is to stay focused and organized, and to prioritize the most important information. With practice and proper planning, you can complete the Academic Writing Task 1 within the given time limit and achieve a high score.

IELTS Academic Writing Task 1 – How to select key information, rather than describing everything
IELTS Academic Writing Task 1 - How to select key information, rather than describing everything. In IELTS Academic Writing Task 1, it is important to select and present the key information in an organized and coherent way, rather than describing everything...
IELTS Academic Writing Task 1 – Six Types
IELTS Academic Writing Task 1 - What the six types of questions are In IELTS Academic Writing Task 1, there are six types of questions that can be asked. These are: Line Graphs: A line graph displays changes in data over time. You will be asked to describe and...
How to receive a good score Academic Writing Task 1
How to receive a good score Academic Writing Task 1 To receive a good score in Academic Writing Task 1 of the IELTS exam, you should focus on the following: Task Achievement: Ensure that you have fully addressed the question prompt and provided a clear and concise...
IELTS Writing Task 1 – Maps
IELTS Writing Task 1 – Maps IELTS Academic Writing Task 1 may also include maps as the visual representation. Maps may show the changes in a particular area over time, such as the growth of a city or the development of a region. When describing maps, it is...
IELTS Writing Task 1 – Process Diagram
IELTS Writing Task 1 – Process Diagram In IELTS Writing Task 1, a process diagram is a common type of visual representation that describes how something works or is made. The diagram shows a series of steps or stages that are taken to complete a process. To...
IELTS Writting Task 1 Sample Essays
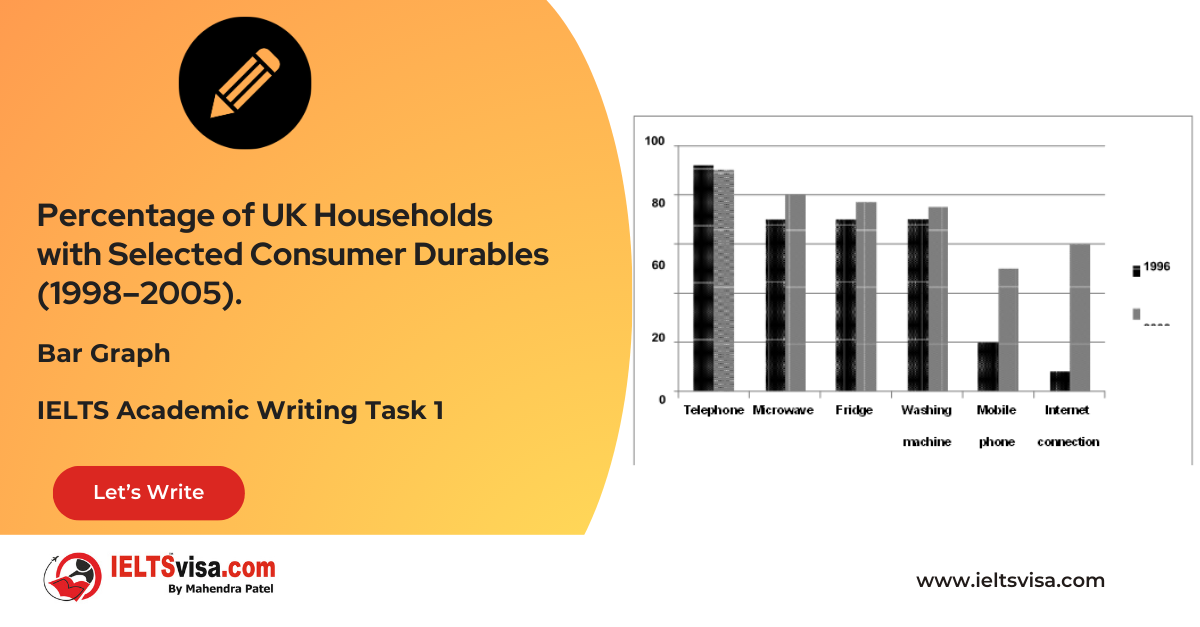
Task 1 – Bar Graph – Percentage of UK Households with Selected Consumer Durables (1998–2005).
The chart...
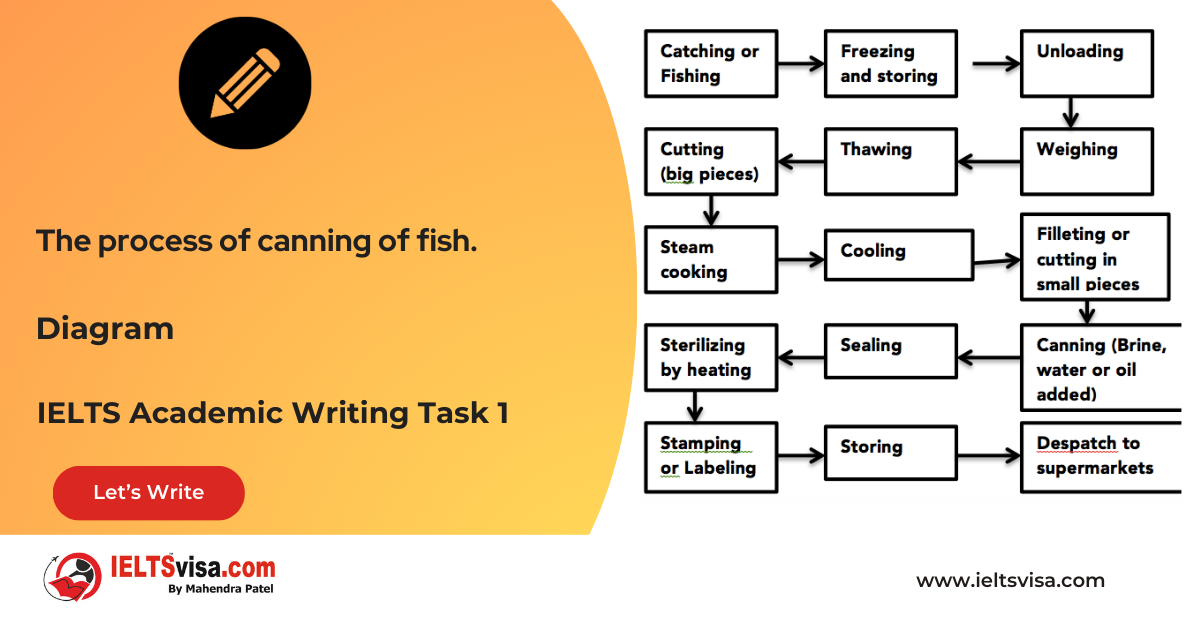
Task 1 – Diagram – The process of canning of fish.
20:00 Start Pause Stop [df_adh_heading title_infix="IELTS Writing Task 1 Question" use_divider="on" divider_color="#000000" divider_height="3px" divider_width="11%" _builder_version="4.27.0" _module_preset="default" t_infix_font="||||||||"...
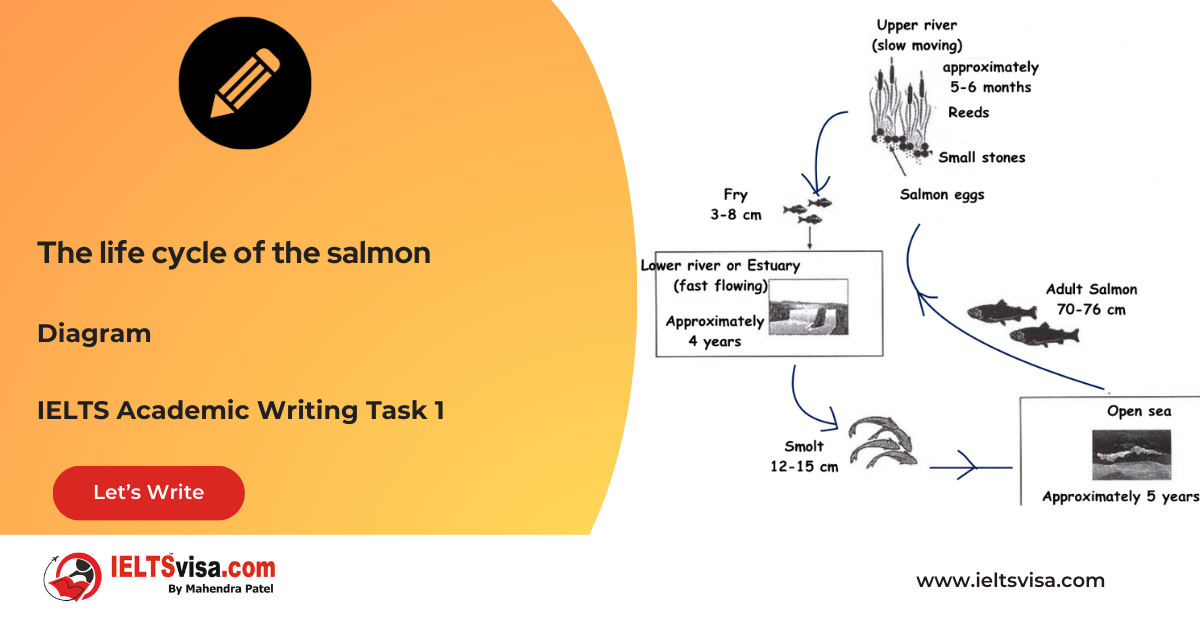
Task 1 – Diagram – The life cycle of the salmon
20:00 Start Pause Stop [df_adh_heading title_infix="IELTS Writing Task 1 Question" use_divider="on" divider_color="#000000" divider_height="3px" divider_width="11%" _builder_version="4.27.0" _module_preset="default" hover_enabled="0"...
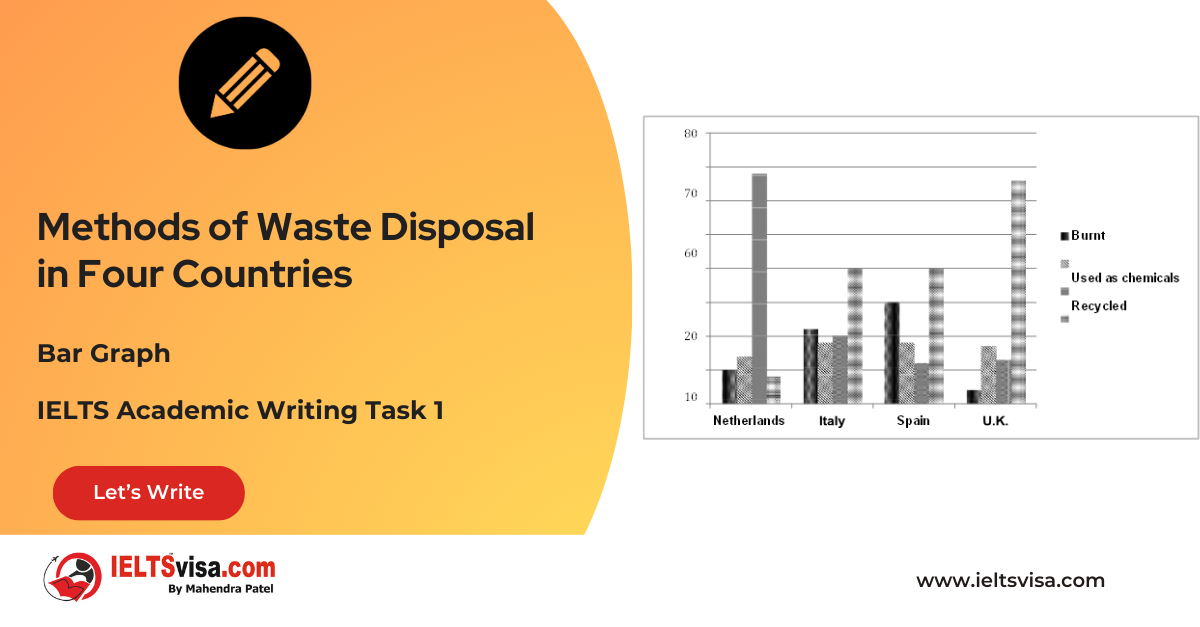
Task 1 – Bar Graph – Methods of Waste Disposal in Four Countries
[df_adh_heading title_infix="IELTS Writing Task 1 Question" use_divider="on" divider_color="#000000" divider_height="3px" divider_width="11%" _builder_version="4.27.0" _module_preset="default" hover_enabled="0" global_colors_info="{}"...
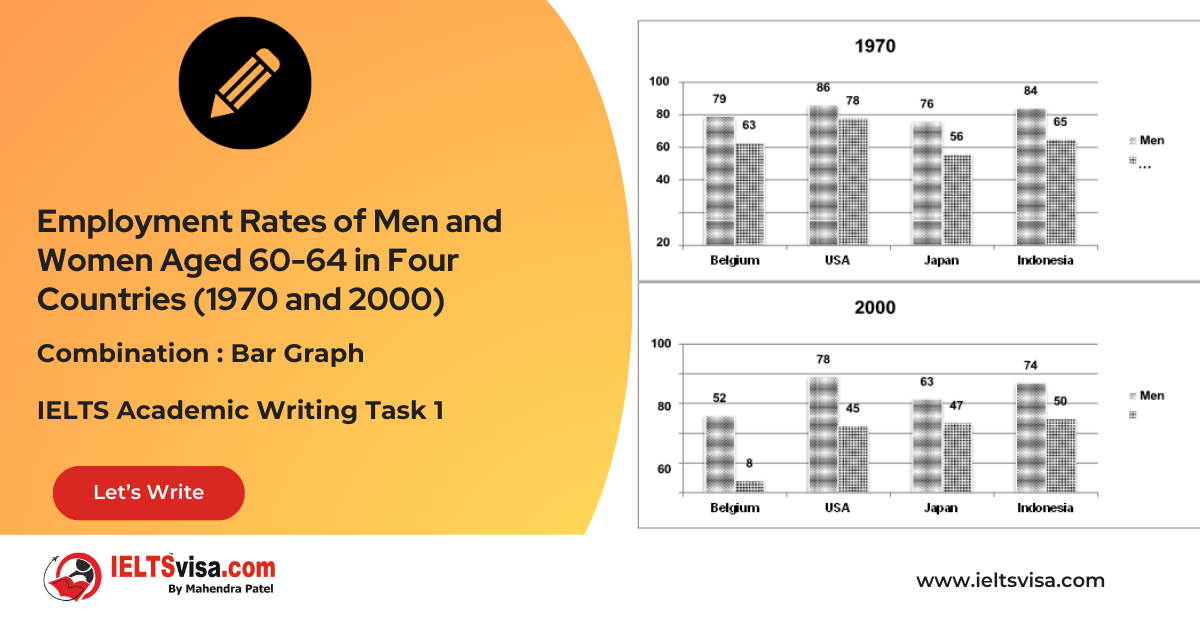
Task 1 – Combination : Bar Graph – Employment Rates of Men and Women Aged 60-64 in Four Countries (1970 and 2000)
[df_adh_heading title_infix="IELTS Writing Task 1 Question" use_divider="on" divider_color="#000000" divider_height="3px" divider_width="11%" _builder_version="4.27.0" _module_preset="default" t_infix_font="|700|||||||"...


