IELTS Academic Writing Task 1- Task Achievement/Task Response:
Charts, Graphs, Tables
In Academic Writing Task 1 of the IELTS exam, you will be given a chart, graph, table or diagram and asked to describe and summarize the information in your own words. The task requires you to:
- Analyze the information presented: Carefully examine the chart/graph/table/diagram and understand the main features, trends, and patterns.
- Identify the key points: Determine the most important information that needs to be conveyed in your response.
- Organize your writing: Plan how you will present the information in a logical and clear manner. This could involve grouping related data, comparing and contrasting different aspects of the information, and using appropriate vocabulary to describe trends.
- Write a clear and concise response: Use correct grammar, spelling and punctuation, and stay within the word count limits. Ensure that you have addressed all parts of the question and that your response is relevant to the task.
To achieve a high score in Task Achievement/Task Response, make sure you have fully answered the question asked and provided all the required information. Your response should be well-organized and easy to follow, with accurate use of data and appropriate vocabulary. Additionally, ensure that you have used a variety of sentence structures and linked your ideas coherently to achieve a smooth flow of information.
Process Diagrams
In Academic Writing Task 1 of the IELTS exam, you may also be presented with a process diagram, which shows a sequence of steps or stages involved in a particular process. To achieve high marks in Task Achievement/Task Response, you should:
- Analyze the process: Study the diagram carefully to understand the different stages involved in the process, and identify the key features and components.
- Plan your writing: Plan how you will present the information in a logical and clear manner, highlighting the most important stages of the process.
- Write an overview: Write an introduction that provides an overview of the process and the purpose of the process.
- Describe the process: Use a variety of sentence structures to describe the process in detail, using appropriate vocabulary and accurate information. Your description should be well-organized and easy to follow.
- Write a conclusion: Summarize the main stages of the process and draw conclusions based on the information presented.
To score well in Task Achievement/Task Response for process diagrams, it is important to ensure that you have fully answered the question and provided a clear and concise description of the process. Make sure that you have highlighted the main stages and key features of the process, and that you have used appropriate vocabulary and accurate information. Additionally, ensure that you have used a variety of sentence structures and linked your ideas coherently to achieve a smooth flow of information.
Cohesion and Coherence – Structuring Your Answer into Paragraphs
IELTS Academic Writing Task 1In the IELTS Academic Writing Task 1, it is important to provide accurate information and make comparisons effectively and to present your answer well-structured and coherently. Organising your response into paragraphs helps to improve...
Cohesion and Coherence – Describing Striking Features and Trends
IELTS Academic Writing Task 1In the IELTS Academic Writing Task 1, describing striking features such as changes and trends in the given visual data is essential to demonstrate your analytical skills. It allows you to highlight significant shifts, increases, decreases,...

Cohesion and Coherence – How to Write Comparisons and Avoid Simply Listing Information
IELTS Academic Writing Task 1The IELTS Academic Writing Task 1 requires candidates to analyze and describe visual data, such as graphs, charts, or diagrams. One crucial aspect of this task is demonstrating cohesion and coherence in your writing, which involves...
Processes – Proofreading and Checking for Grammatical Errors, such as Subject-Verb Agreement and Verb Tense Consistency
IELTS Academic Writing Task 1In the IELTS Academic Writing Task 1, it is crucial to demonstrate a strong command of grammar and language. One common area where candidates may make errors is in subject-verb agreement and verb-tense consistency. Proofreading and...

Processes – Using Accurate and Varied Sentence Structures to Avoid Repetition
IELTS Academic Writing Task 1In the IELTS Academic Writing Task 1, candidates often describe processes using a series of sentences. Accurate and varied sentence structures are essential to achieving a higher score and avoiding unnecessary repetition. By employing...
IELTS Writting Task 1 Sample Essays

Task 1 – Column graph – Percentage of Young People Enrolled in Universities in 2000 and 2007.
20:00 Start Pause Stop [df_adh_heading title_infix="IELTS Writing Task 1 Question" use_divider="on" divider_color="#000000" divider_height="3px" divider_width="11%" _builder_version="4.27.0" _module_preset="default"...
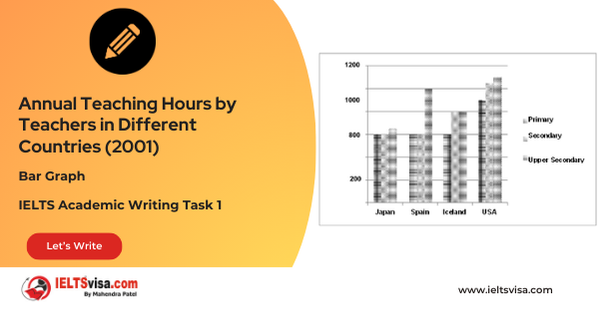
Task 1 – Bar Graph – Annual Teaching Hours by Teachers in Different Countries (2001)
20:00 Start Pause Stop [df_adh_heading title_infix="IELTS Writing Task 1 Question" use_divider="on" divider_color="#000000" divider_height="3px" divider_width="11%" _builder_version="4.27.0" _module_preset="default"...
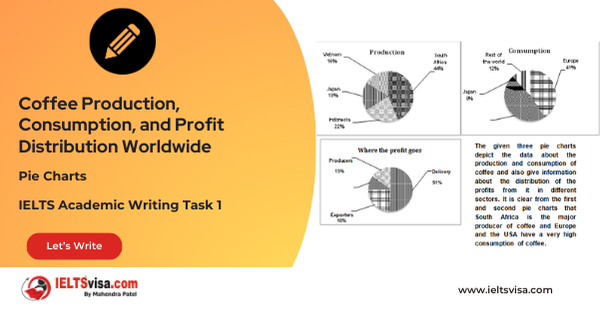
Task 1 – Pie Charts – Coffee Production, Consumption, and Profit Distribution Worldwide
20:00 Start Pause Stop [df_adh_heading title_infix="IELTS Writing Task 1 Question" use_divider="on" divider_color="#000000" divider_height="3px" divider_width="11%" _builder_version="4.27.0" _module_preset="default"...

Task 1 – Column graph – Types of Transport Used by Tourists Visiting New Zealand from Five Countries in 2004.
20:00 Start Pause Stop [df_adh_heading title_infix="IELTS Writing Task 1 Question" use_divider="on" divider_color="#000000" divider_height="3px" divider_width="11%" _builder_version="4.27.0" _module_preset="default"...
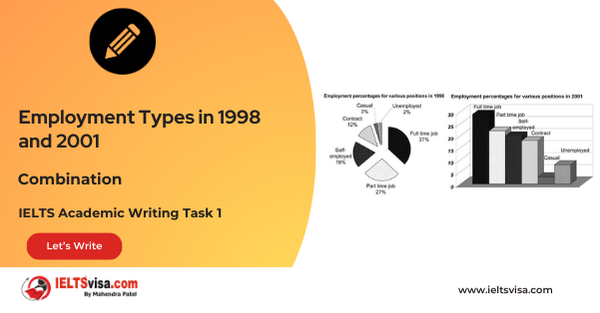
Task 1 – Bar and Pie Chart Combination – Employment Types in 1998 and 2001
20:00 Start Pause Stop [df_adh_heading title_infix="IELTS Writing Task 1 Question" use_divider="on" divider_color="#000000" divider_height="3px" divider_width="11%" _builder_version="4.27.0" _module_preset="default"...


