ACADEMIC WRITING TASK 1: Time Management
Time management is essential when completing the Academic Writing Task 1 of the IELTS exam, especially when dealing with charts, graphs, and tables. Here are some tips to help manage your time effectively:
- Plan your writing: Spend 5-10 minutes analyzing the chart or graph, identifying the key features and trends, and planning your report. This will help you organize your writing and save time later.
- Use the given time wisely: You have 20 minutes to complete Task 1, so use the time wisely. Focus on the key features and trends, and avoid getting bogged down in too much detail.
- Write efficiently: Write concisely and clearly, using simple sentences and appropriate vocabulary. Use bullet points or tables to organize your data, which can save time and make your report easier to read.
- Check your work: Allow 2-3 minutes at the end to check your work for errors in grammar, spelling, and punctuation.
- Practice: Practicing writing Task 1 under timed conditions can help you become more efficient and confident in your writing, allowing you to better manage your time on exam day.
Remember, the key to effective time management is to stay focused and organized, and to prioritize the most important information. With practice and proper planning, you can complete the Academic Writing Task 1 within the given time limit and achieve a high score.

Cohesion and Coherence – Structuring Your Answer into Paragraphs
IELTS Academic Writing Task 1In the IELTS Academic Writing Task 1, it is important to provide accurate information and make comparisons effectively and to present your answer well-structured and coherently. Organising your response into paragraphs helps to improve...

Cohesion and Coherence – Describing Striking Features and Trends
IELTS Academic Writing Task 1In the IELTS Academic Writing Task 1, describing striking features such as changes and trends in the given visual data is essential to demonstrate your analytical skills. It allows you to highlight significant shifts, increases, decreases,...

Cohesion and Coherence – How to Write Comparisons and Avoid Simply Listing Information
IELTS Academic Writing Task 1The IELTS Academic Writing Task 1 requires candidates to analyze and describe visual data, such as graphs, charts, or diagrams. One crucial aspect of this task is demonstrating cohesion and coherence in your writing, which involves...
Processes – Proofreading and Checking for Grammatical Errors, such as Subject-Verb Agreement and Verb Tense Consistency
IELTS Academic Writing Task 1In the IELTS Academic Writing Task 1, it is crucial to demonstrate a strong command of grammar and language. One common area where candidates may make errors is in subject-verb agreement and verb-tense consistency. Proofreading and...
Processes – Using Accurate and Varied Sentence Structures to Avoid Repetition
IELTS Academic Writing Task 1In the IELTS Academic Writing Task 1, candidates often describe processes using a series of sentences. Accurate and varied sentence structures are essential to achieving a higher score and avoiding unnecessary repetition. By employing...
IELTS Writting Task 1 Sample Essays
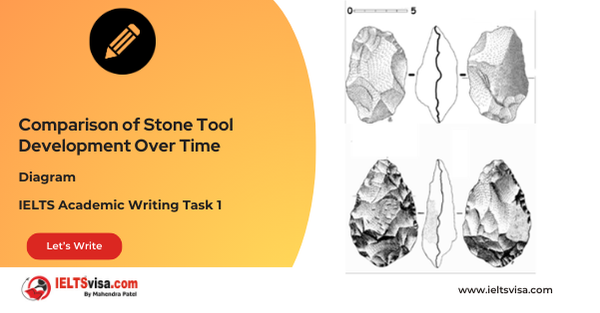
Task 1 – Diagram – Comparison of Stone Tool Development Over Time
20:00 Start Pause Stop [df_adh_heading title_infix="IELTS Writing Task 1 Question" use_divider="on" divider_color="#000000" divider_height="3px" divider_width="11%" _builder_version="4.27.0" _module_preset="default"...
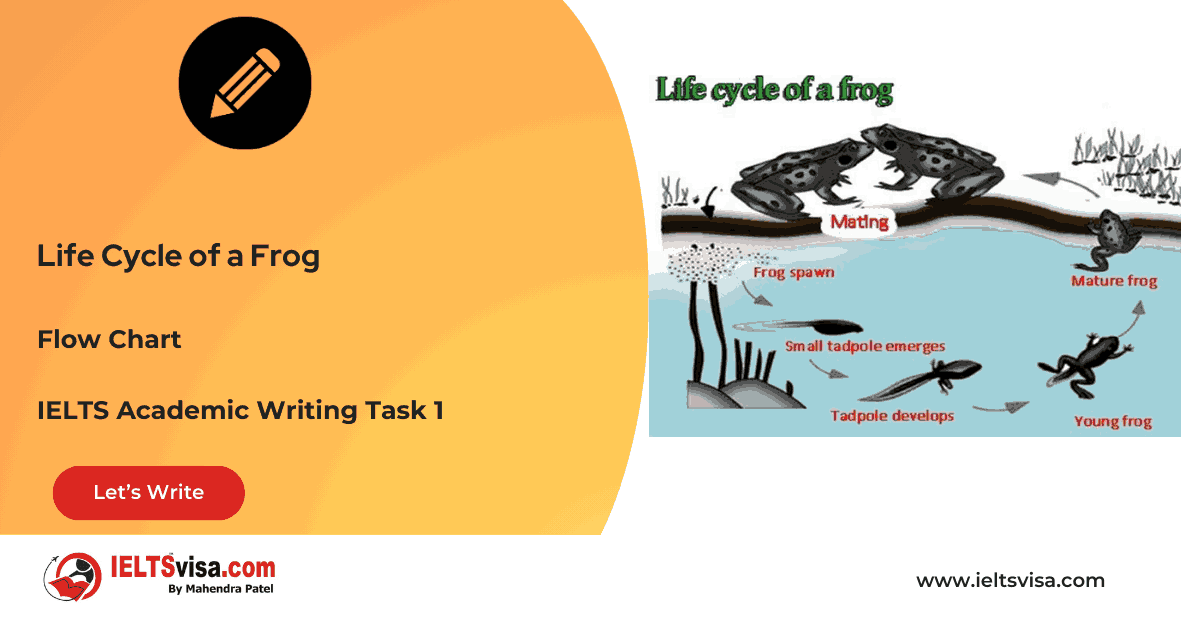
Task 1 – Flow chart -Life Cycle of a Frog
20:00 Start Pause Stop [df_adh_heading title_infix="IELTS Writing Task 1 Question" use_divider="on" divider_color="#000000" divider_height="3px" divider_width="11%" _builder_version="4.27.0" _module_preset="default"...
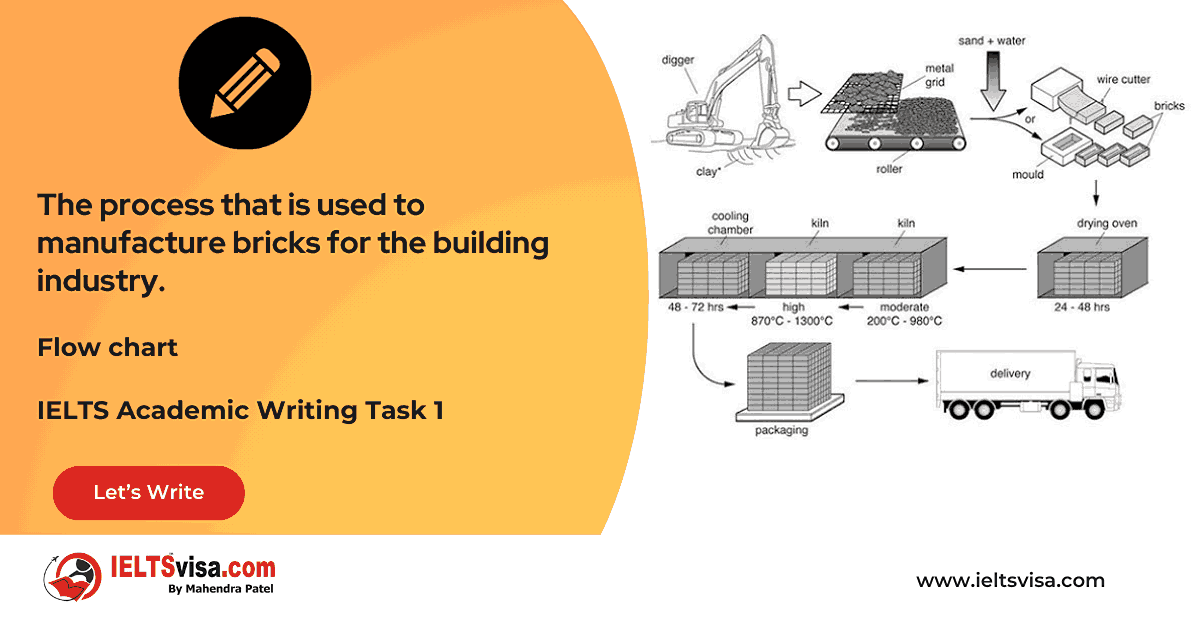
Task 1 – Flow chart -The process that is used to manufacture bricks for the building industry.
20:00 Start Pause Stop [df_adh_heading title_infix="IELTS Writing Task 1 Question" use_divider="on" divider_color="#000000" divider_height="3px" divider_width="11%" _builder_version="4.27.0" _module_preset="default"...
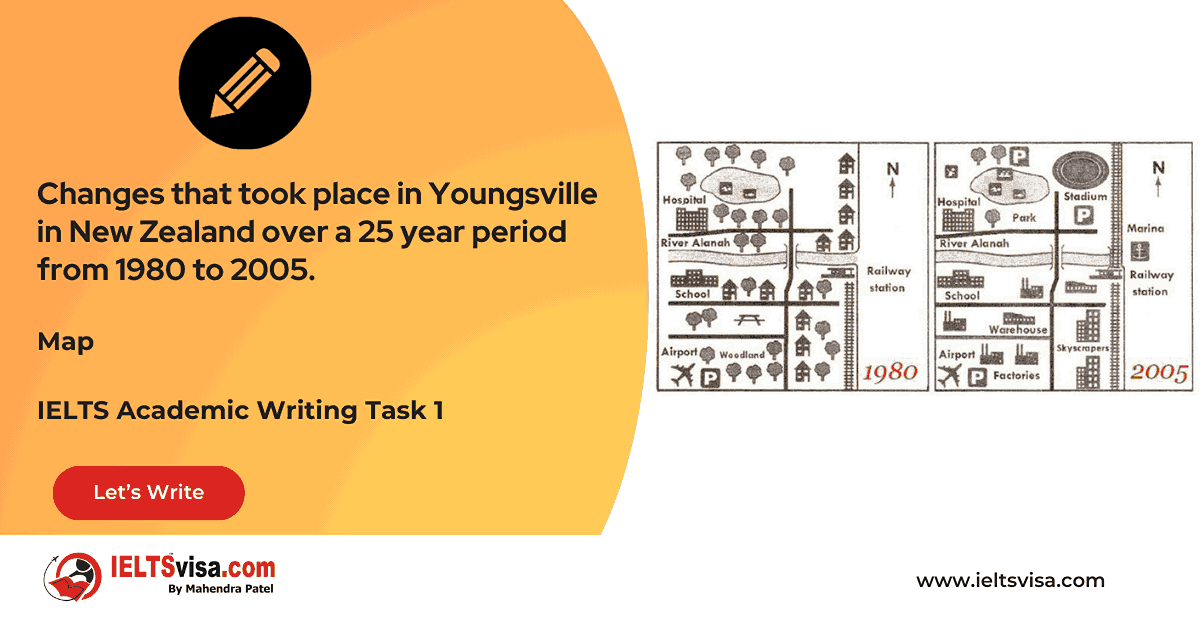
Task 1 – Map – Changes that took place in Youngsville in New Zealand over a 25 year period from 1980 to 2005.
20:00 Start Pause Stop [df_adh_heading title_infix="IELTS Writing Task 1 Question" use_divider="on" divider_color="#000000" divider_height="3px" divider_width="11%" _builder_version="4.27.0" _module_preset="default"...
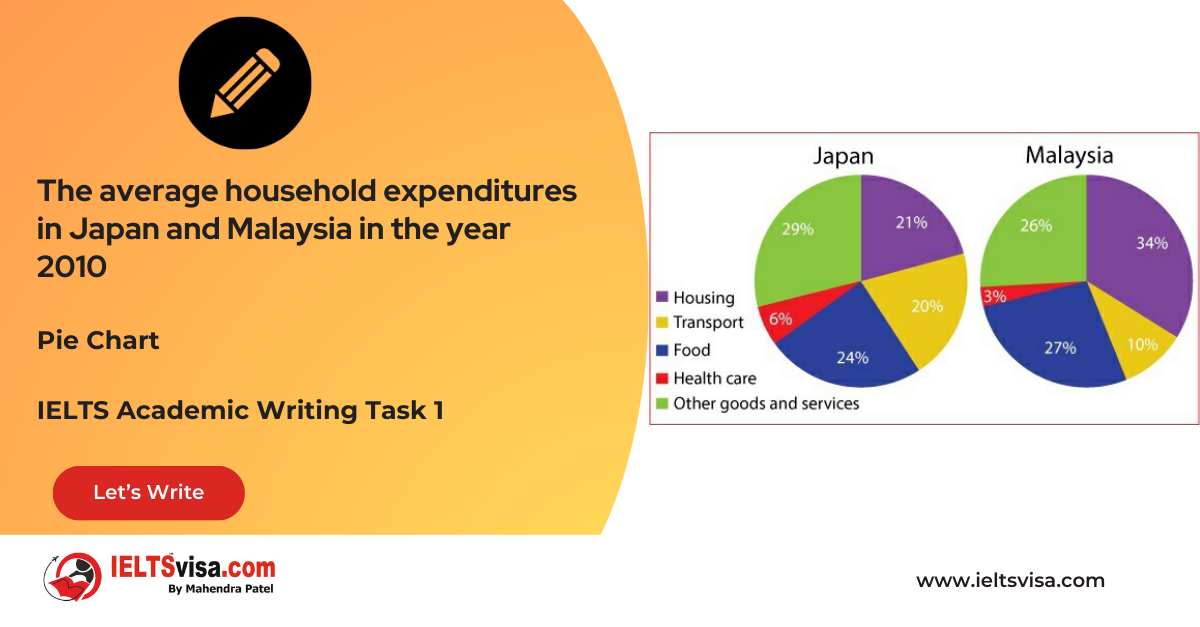
Task 1 – Pie Chart – The average household expenditures in Japan and Malaysia in the year 2010
20:00 Start Pause Stop [df_adh_heading title_infix="IELTS Writing Task 1 Question" use_divider="on" divider_color="#000000" divider_height="3px" divider_width="11%" _builder_version="4.27.0" _module_preset="default"...


