How to Write an Overview
IELTS Academic Writing Task 1
In IELTS Academic Writing Task 1, the overview is an important part of your report, as it provides a summary of the main features and trends in the visual data presented. Here are some tips on how to write an effective overview:
1.Identify the main features:
Spend some time analyzing the chart or graph and identifying the main features, trends, and patterns.
2. Focus on the most significant information:
In your overview, focus on the most significant information and trends that are easily noticeable, rather than minor details.
3. Use general language:
Write in a general language and avoid using specific figures or data. Use a range of appropriate vocabulary to describe the trends and features in a concise manner.
4. Write in a separate paragraph: Write
your overview in a separate paragraph, after your introduction. This will provide a clear summary of the main features and trends in the data.
5. Be concise:
Keep your overview concise and to-the-point, aiming for 2-3 sentences.
Remember, the purpose of the overview is to provide a clear and concise summary of the main features and trends in the visual data presented. Keep it focused, concise, and informative, and ensure that it complements the information provided in the body paragraphs.
Here is an example of an effective overview for a chart/table/diagram:
“Overall, the chart/table/diagram shows that [brief description of the main trend or feature], while [brief description of another trend or feature]. In general, [brief conclusion or summary].”
More examples of effective overviews for different types of visual data:
For a line graph:
“Overall, the line graph shows a gradual increase/decrease in [variable] over the period [timeframe]. The [variable] started at [starting point], rose/fell to [peak/lowest point], and then leveled off/stabilized towards the end of the period.”
For a bar chart:
“Overall, the bar chart shows that [category 1] had the highest/lowest [data point], followed by [category 2] and [category 3]. The [category] with the highest [data point] was [specific category], while the [category] with the lowest [data point] was [specific category].”
For a pie chart:
“Overall, the pie chart shows that [category 1] had the largest/smallest share of [total data], followed by [category 2] and [category 3]. [Specific category] had the largest/smallest share of the [total data], at [percentage].”
For a table:
“Overall, the table shows that [category 1] had the highest/lowest [data point], followed by [category 2] and [category 3]. The [category] with the highest/lowest [data point] was [specific category], at [data point].”
Remember, the key to an effective overview is to identify the main features and trends in the visual data, and to provide a clear and concise summary that complements the information in the body paragraphs. Practice writing overviews for different types of visual data to become more comfortable and proficient at this skill.
IELTS Task 1- How to Write an Overview for process and diagram
In IELTS Academic Writing Task 1, you may also encounter process diagrams, flowcharts, and other types of diagrams. Here are some tips on how to write an effective overview for these types of visual data:
1. Identify the key stages:
Examine the process or diagram carefully and identify the key stages or steps involved.
2. Use general language:
As with other types of visual data, use general language to describe the main features of the process or diagram.
3. Focus on the overall flow:
Describe the overall flow of the process or diagram, including any significant changes or patterns.
4. Use sequencing words:
Use sequencing words such as “first”, “next”, “then”, and “finally” to describe the order of the steps.
5. Be concise:
Keep your overview concise, aiming for 2-3 sentences.
Here is an example of an effective overview for a process diagram:
“Overall, the process diagram shows the various stages involved in [process]. The process starts with [first step], followed by [second step], and then [third step]. The final stage involves [last step], resulting in [outcome].”
For a process diagram with multiple stages:
“Overall, the process diagram outlines the various stages involved in [process]. The process begins with [first stage], followed by [second stage], [third stage], and [fourth stage]. The final stage involves [last stage], resulting in [outcome].”
For a process diagram with branching paths:
“Overall, the process diagram shows the various paths involved in [process]. The process begins with [first step], which leads to [second step] and [third step]. From there, [path A] leads to [fourth step], while [path B] leads to [fifth step]. The final steps involve [last step], resulting in [outcome].”
For a process diagram with feedback loops:
“Overall, the process diagram illustrates the feedback loop involved in [process]. The process starts with [first step], followed by [second step], and then [third step]. From there, the process loops back to [second step] until [condition is met]. The final stage involves [last step], resulting in [outcome].”
Remember, the key to an effective overview for process diagrams is to identify the main stages or steps involved, and to describe the overall flow in a clear and concise manner. Practice writing overviews for different types of process diagrams to become more comfortable and proficient at this skill.
Here is an example of an effective overview for a flowchart:
“Overall, the flowchart shows the various steps involved in [process]. The flowchart starts with [first step], followed by [second step], and then [third step]. The final step is [last step], resulting in [outcome].”
For a flowchart with multiple decision points:
“Overall, the flowchart shows the various decision points involved in [process]. The flowchart starts with [first step], followed by a decision point where [decision A] leads to [second step], while [decision B] leads to [third step]. From there, the flowchart includes another decision point where [decision C] leads to [fourth step], while [decision D] leads to [fifth step]. The final step involves [last step], resulting in [outcome].”
For a flowchart with feedback loops:
“Overall, the flowchart illustrates the feedback loop involved in [process]. The flowchart starts with [first step], followed by [second step], and then [third step]. From there, the flowchart loops back to [second step] until [condition is met]. The final step involves [last step], resulting in [outcome].”
For a flowchart with multiple paths:
“Overall, the flowchart shows the various paths involved in [process]. The flowchart starts with [first step], which can lead to [second step], [third step], or [fourth step]. From there, [path A] leads to [fifth step], while [path B] leads to [sixth step]. The final steps involve [last step], resulting in [outcome].”
Remember, the key to an effective overview for flowcharts is to identify the main decision points, paths, or feedback loops involved, and to describe the overall flow in a clear and concise manner. Practice writing overviews for different types of flowcharts to become more comfortable and proficient at this skill.


Our Books
Master IELTS Speaking Part 1
IELTS Writing Task 1 Book
IELTS Writing Task 2 Book
Practice IELTS Other Modules
IELTS Listening
The IELTS Listening test assesses how well you can understand spoken English in various contexts. It lasts about 30 minutes and is divided into four sections with a total of 40 questions. The listening tasks become increasingly difficult as the test progresses.
IELTS Academic Reading
The IELTS Academic Reading section assesses your ability to understand and interpret a variety of texts in academic settings. It is designed to evaluate a range of reading skills, including skimming for gist, reading for main ideas, reading for detail, understanding inferences, and recognizing a writer's opinions and arguments.
IELTS Speaking
The IELTS Speaking test assesses your ability to communicate in English on everyday topics. It lasts 11-14 minutes and consists of three parts: introduction, cue card, and a discussion based on the cue card topic.
IELTS General Reading
IELTS General Reading tests your ability to understand and interpret various types of texts. Here are some key areas and types of content you can expect to encounter in the reading section, along with tips for effective preparation.
IELTS Academic Writing Task 1
In IELTS Academic Writing Task 1, you are presented with a visual representation of information, such as graphs, charts, tables, or diagrams, and you are required to summarize, compare, or explain the data in your own words.
IELTS General Writing Task 1
In IELTS General Writing Task 1, you are required to write a letter based on a given situation. The letter can be formal, semi-formal, or informal, depending on the prompt. Here’s a breakdown of the key components to include in your letter
IELTS Academic Writing Task 2
In IELTS Academic Writing Task 2, you are required to write an essay in response to a question or topic. Here’s a guide to help you understand the essential elements of this task
IELTS Exam Tips
To succeed in the IELTS exam, practice regularly, familiarize yourself with the test format, improve your vocabulary, develop time management skills, and take mock tests to build confidence.
Grammer for IELTS
Grammar is the foundation of effective communication in English. Understanding tense usage, subject-verb agreement, and sentence structure enhances clarity and coherence in writing and speaking.
Vocabulary for IELTS
Vocabulary plays a crucial role in the IELTS (International English Language Testing System) exam, especially in the Speaking and Writing sections. Here’s an overview of why vocabulary is important and how it impacts your performance
RECENT IELTS SAMPLES QUESTIONS AND ANSWERS
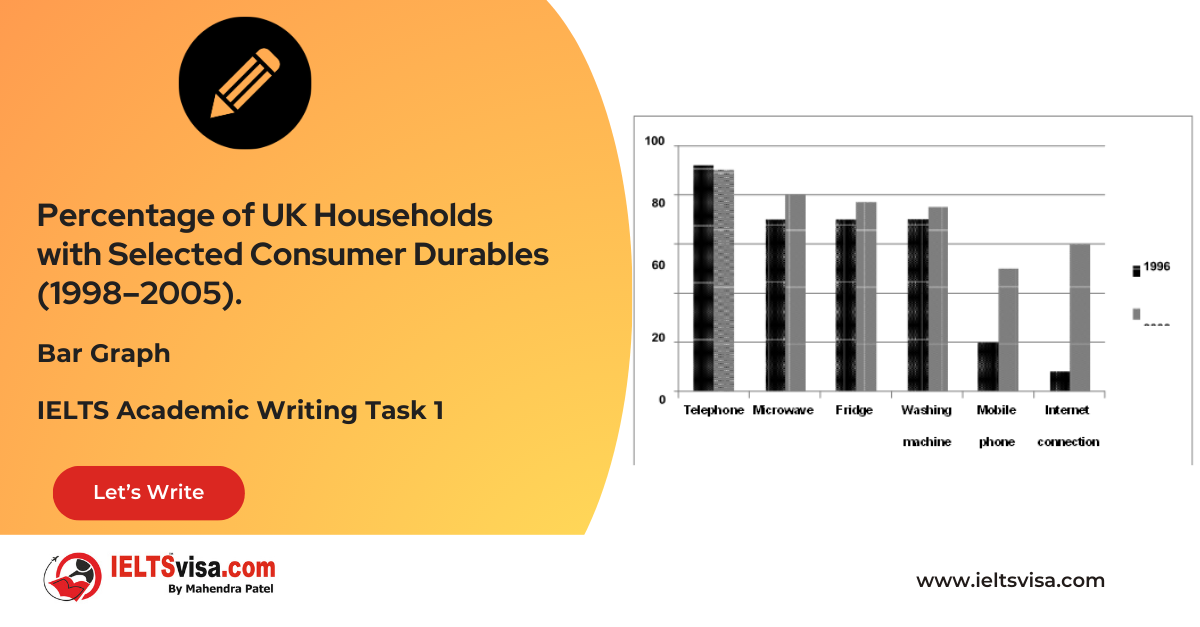
Task 1 – Bar Graph – Percentage of UK Households with Selected Consumer Durables (1998–2005).
[df_adh_heading title_infix="IELTS Writing Task 1 Question" use_divider="on"...
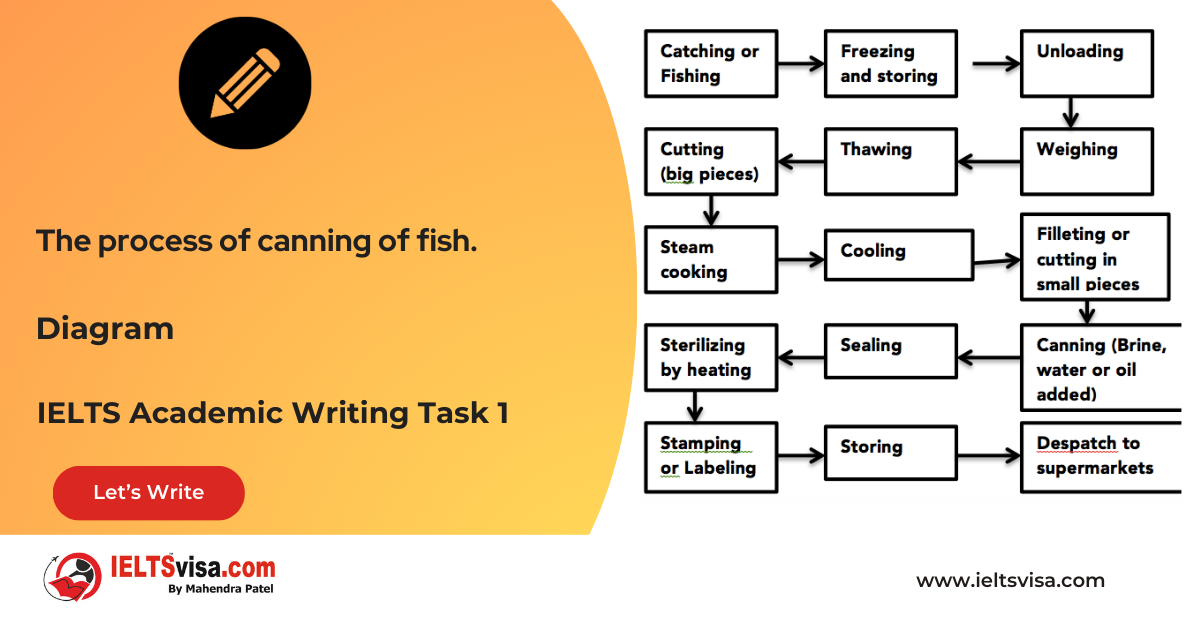
Task 1 – Diagram – The process of canning of fish.
20:00 Start Pause Stop [df_adh_heading title_infix="IELTS Writing Task 1 Question" use_divider="on"...
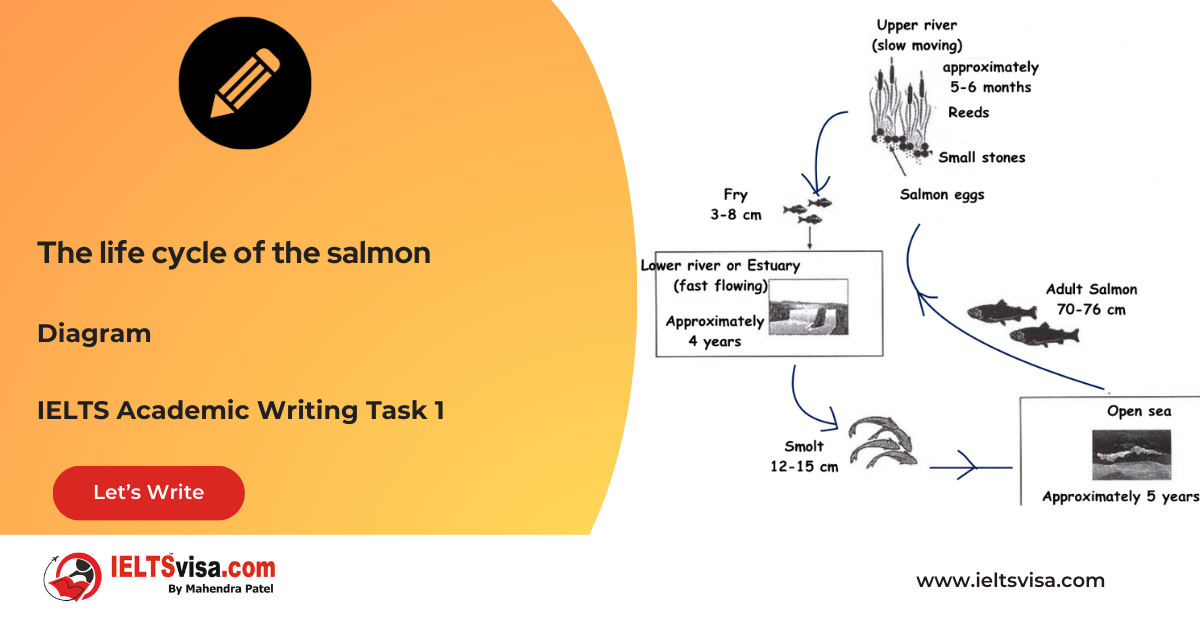
Task 1 – Diagram – The life cycle of the salmon
20:00 Start Pause Stop [df_adh_heading title_infix="IELTS Writing Task 1 Question" use_divider="on"...
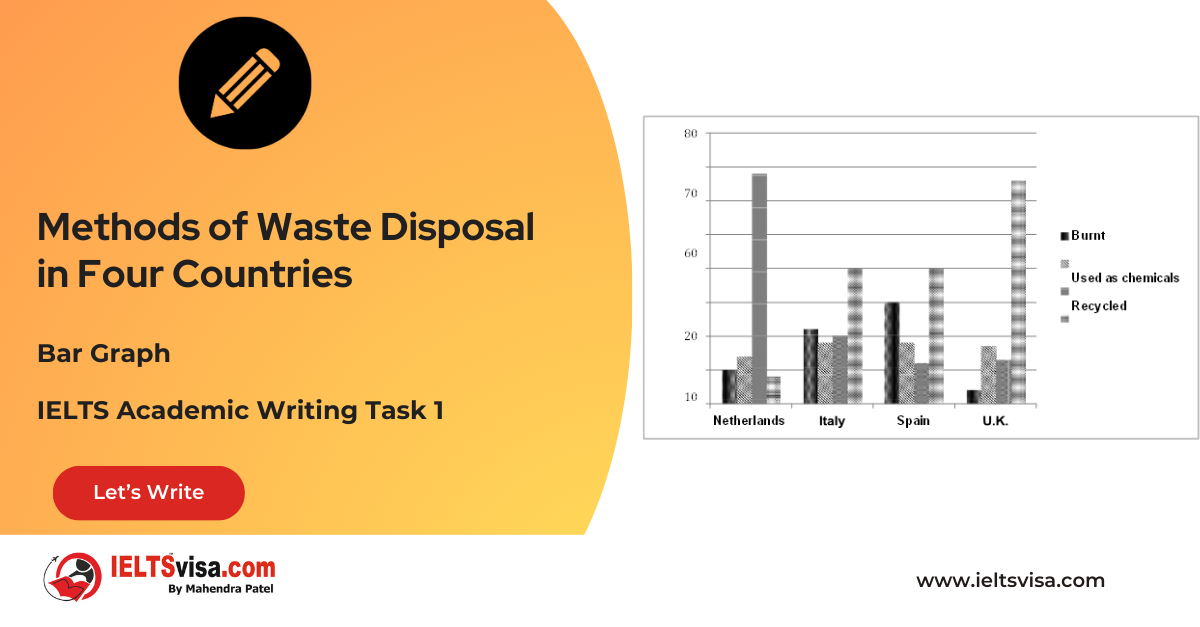
Task 1 – Bar Graph – Methods of Waste Disposal in Four Countries
[df_adh_heading title_infix="IELTS Writing Task 1 Question" use_divider="on"...
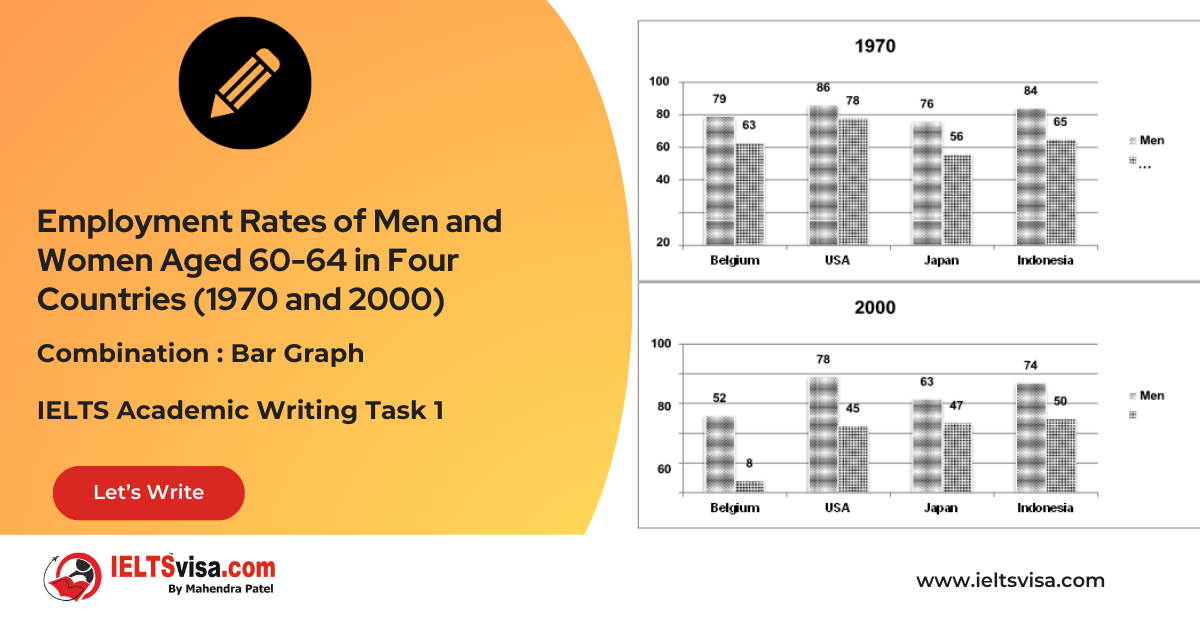
Task 1 – Combination : Bar Graph – Employment Rates of Men and Women Aged 60-64 in Four Countries (1970 and 2000)
[df_adh_heading title_infix="IELTS Writing Task 1 Question" use_divider="on"...
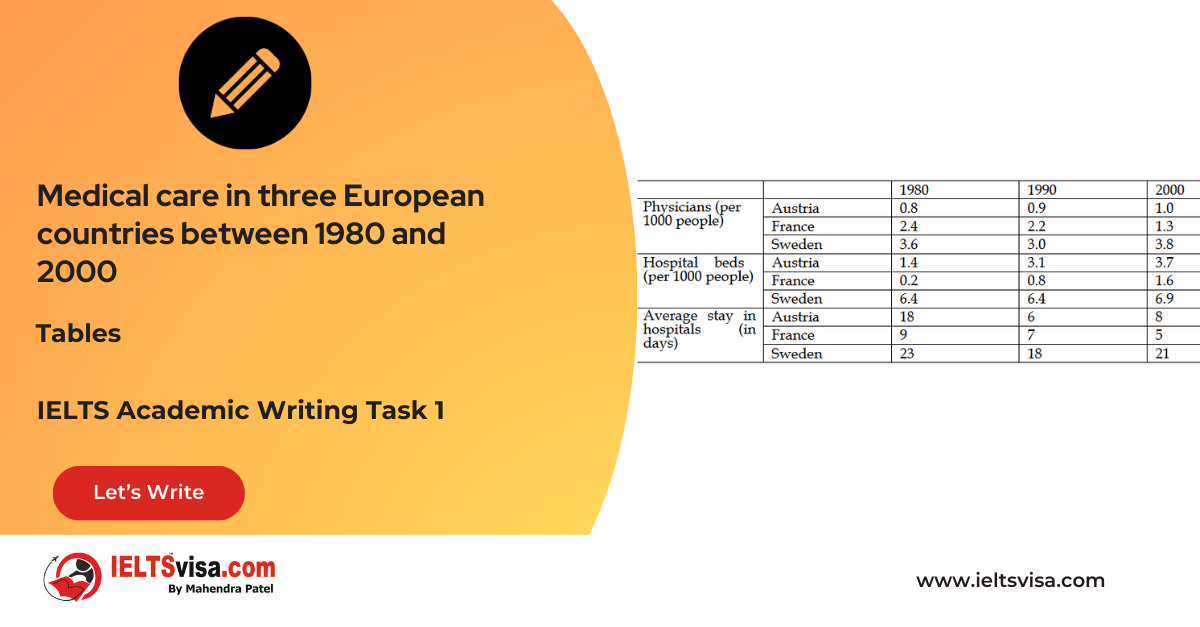
Task 1 – Table – The information about medical care in three European countries between 1980 and 2000
20:00 Start Pause Stop [df_adh_heading title_infix="IELTS Writing Task 1 Question" use_divider="on"...
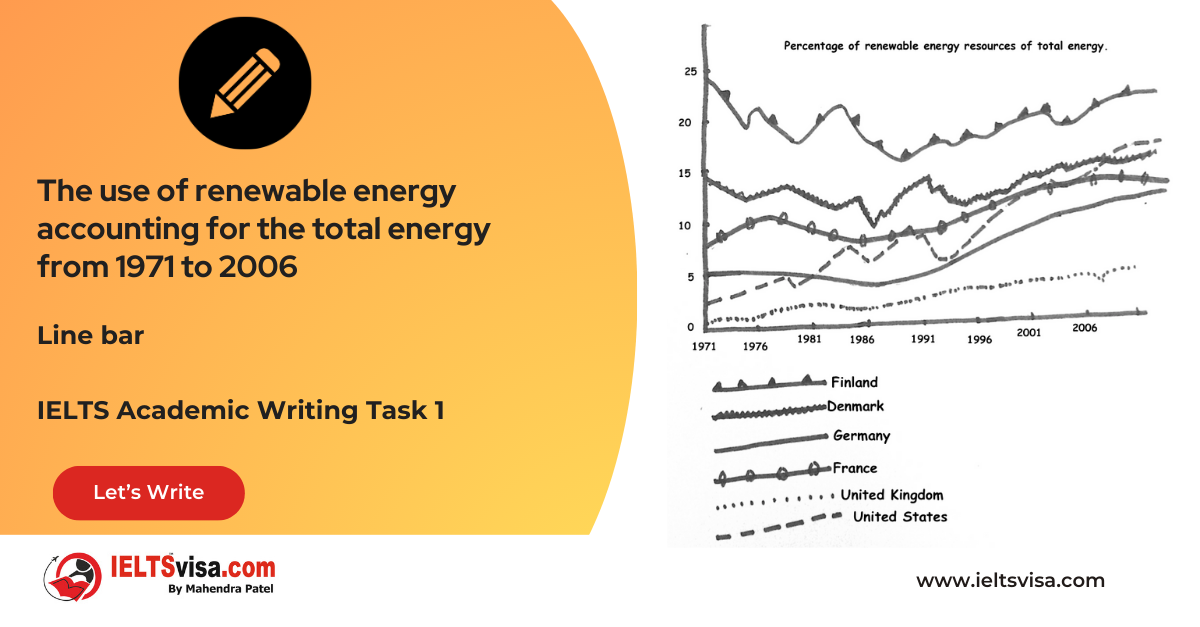
Task 1 – Line bar – The use of renewable energy accounting for the total energy from 1971 to 2006
20:00 Start Pause Stop [df_adh_heading title_infix="IELTS Writing Task 1 Question" use_divider="on"...
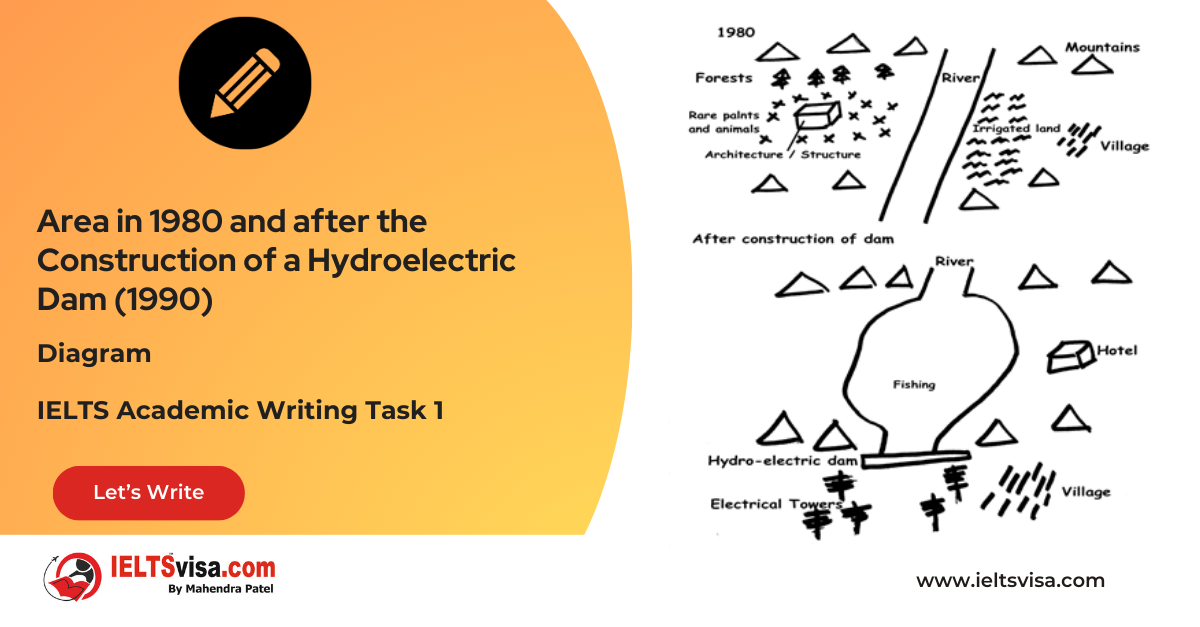
Task 1 – Diagram – Area in 1980 and after the Construction of a Hydroelectric Dam (1990)
[df_adh_heading title_infix="IELTS Writing Task 1 Question" use_divider="on"...
Task 1 – Line Graph – Number of Four Fish Species (1982–2007)
[df_adh_heading title_infix="IELTS Writing Task 1 Question" use_divider="on"...

