How to Write Comparisons and Avoid Simply Listing Information
Cohesion and CoherenceIELTS Academic Writing Task 1
The IELTS Academic Writing Task 1 requires candidates to analyze and describe visual data, such as graphs, charts, or diagrams. One crucial aspect of this task is demonstrating cohesion and coherence in your writing, which involves organizing information effectively and making meaningful comparisons. This article will explore strategies to write comparisons instead of merely listing information, along with examples and answers to help you master this skill.
Why Comparisons Matter
Comparisons play a vital role in Task 1 because they enhance the clarity and coherence of your response. By comparing and contrasting different aspects of the data, you can highlight trends, patterns, and significant features. This demonstrates your analytical skills and shows the examiner that you can provide a well-structured and logical analysis of the information at hand.
Strategies for Writing Comparisons
1. Identify Key Features:
Before you start writing, carefully examine the visual data and identify the key features or trends that stand out. These features will serve as the basis for your comparisons.
2. Use Comparative Language:
To effectively compare information, it is essential to use appropriate comparative language. Here are some useful phrases to express comparisons:
• In comparison to…
• Similarly…
• Likewise…
• On the other hand…
• In contrast…
• By contrast…
• While…
• Unlike…
• Compared to…
3. Make Connections:
Look for connections between different elements of the data. For example, you can compare data from different years, different categories, or different groups. These connections allow you to demonstrate a deeper understanding of the data and provide more insightful comparisons.
4. Use Data to Support Comparisons:
Ensure that you support your comparisons with specific data or figures from the visual information. This adds credibility to your analysis and reinforces your arguments.
Examples and Answers
To illustrate these strategies, let’s consider a sample question and two model answers that highlight the difference between merely listing information and writing effective comparisons.
Question:
The bar chart below shows the percentage of car ownership in four different countries in 2005 and 2015.
[Insert Bar Chart]
Model Answer 1 (Listing Information):
The bar chart presents the percentage of car ownership in four countries, namely A, B, C, and D, for the years 2005 and 2015. In 2005, Country A had a car ownership rate of 40%, while Country B had 60%. Country C had the lowest rate, with 30%, and Country D had 50%. In 2015, the car ownership rates increased in all countries. Country A had a rate of 50%, while Country B had 70%. Country C increased to 40%, and Country D had the highest rate at 80%.
Model Answer 2 (Effective Comparisons):
The bar chart illustrates the changes in car ownership percentages in four countries (A, B, C, and D) between 2005 and 2015. In 2005, Country B had the highest car ownership rate at 60%, followed closely by Country D at 50%. Meanwhile, Countries A and C had relatively lower ownership rates of 40% and 30%, respectively.
Over the course of ten years, all countries witnessed an increase in car ownership. However, the rates of growth varied significantly among them. While Country B maintained its lead with a 10% increase to reach 70% in 2015, Country D experienced the most substantial growth, doubling its ownership rate to a staggering 80%.
In contrast, the improvements in car ownership for Countries A and C were more modest. Country A saw a 10% rise to reach 50%, whereas Country C experienced a relatively smaller growth of 10%, ending up at 40% in 2015.
By employing comparisons and providing specific data, Model Answer 2 effectively highlights the differences in car ownership rates across the countries and the varying rates of growth over time. It presents a more cohesive and coherent analysis of the information, making it easier for the reader to comprehend the key features of the data.
Mastering the art of writing comparisons in IELTS Academic Writing Task 1 can significantly enhance your score. By following the strategies outlined in this article and practicing with various visual data, you can develop the skills necessary to write coherent and well-structured responses that impress the examiner. Remember to identify key features, use comparative language, make connections, and support your comparisons with specific data. With practice, you’ll be able to confidently analyze visual data and excel in the IELTS exam.

Our Books
Master IELTS Speaking Part 1
IELTS Writing Task 1 Book
IELTS Writing Task 2 Book
Practice IELTS Other Modules
IELTS Listening
The IELTS Listening test assesses how well you can understand spoken English in various contexts. It lasts about 30 minutes and is divided into four sections with a total of 40 questions. The listening tasks become increasingly difficult as the test progresses.
IELTS Academic Reading
The IELTS Academic Reading section assesses your ability to understand and interpret a variety of texts in academic settings. It is designed to evaluate a range of reading skills, including skimming for gist, reading for main ideas, reading for detail, understanding inferences, and recognizing a writer's opinions and arguments.
IELTS Speaking
The IELTS Speaking test assesses your ability to communicate in English on everyday topics. It lasts 11-14 minutes and consists of three parts: introduction, cue card, and a discussion based on the cue card topic.
IELTS General Reading
IELTS General Reading tests your ability to understand and interpret various types of texts. Here are some key areas and types of content you can expect to encounter in the reading section, along with tips for effective preparation.
IELTS Academic Writing Task 1
In IELTS Academic Writing Task 1, you are presented with a visual representation of information, such as graphs, charts, tables, or diagrams, and you are required to summarize, compare, or explain the data in your own words.
IELTS General Writing Task 1
In IELTS General Writing Task 1, you are required to write a letter based on a given situation. The letter can be formal, semi-formal, or informal, depending on the prompt. Here’s a breakdown of the key components to include in your letter
IELTS Academic Writing Task 2
In IELTS Academic Writing Task 2, you are required to write an essay in response to a question or topic. Here’s a guide to help you understand the essential elements of this task
IELTS Exam Tips
To succeed in the IELTS exam, practice regularly, familiarize yourself with the test format, improve your vocabulary, develop time management skills, and take mock tests to build confidence.
Grammer for IELTS
Grammar is the foundation of effective communication in English. Understanding tense usage, subject-verb agreement, and sentence structure enhances clarity and coherence in writing and speaking.
Vocabulary for IELTS
Vocabulary plays a crucial role in the IELTS (International English Language Testing System) exam, especially in the Speaking and Writing sections. Here’s an overview of why vocabulary is important and how it impacts your performance
RECENT IELTS SAMPLES QUESTIONS AND ANSWERS
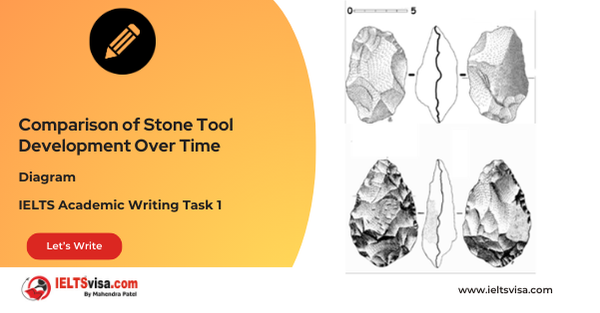
Task 1 – Diagram – Comparison of Stone Tool Development Over Time
20:00 Start Pause Stop [df_adh_heading title_infix="IELTS Writing Task 1 Question" use_divider="on"...
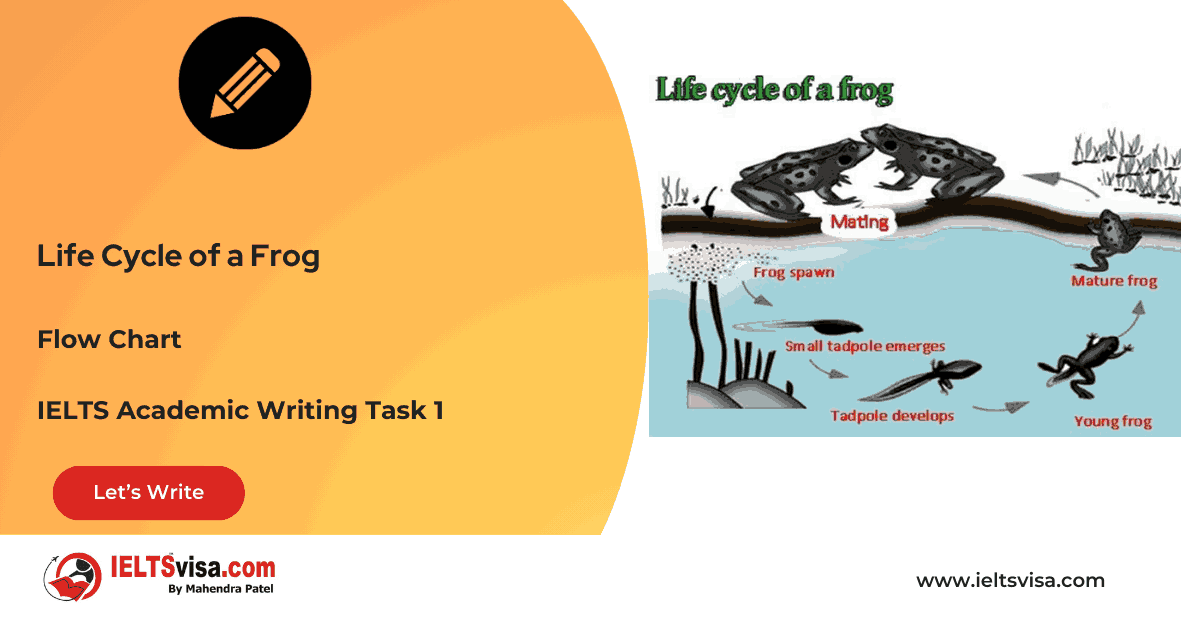
Task 1 – Flow chart -Life Cycle of a Frog
20:00 Start Pause Stop [df_adh_heading title_infix="IELTS Writing Task 1 Question" use_divider="on"...
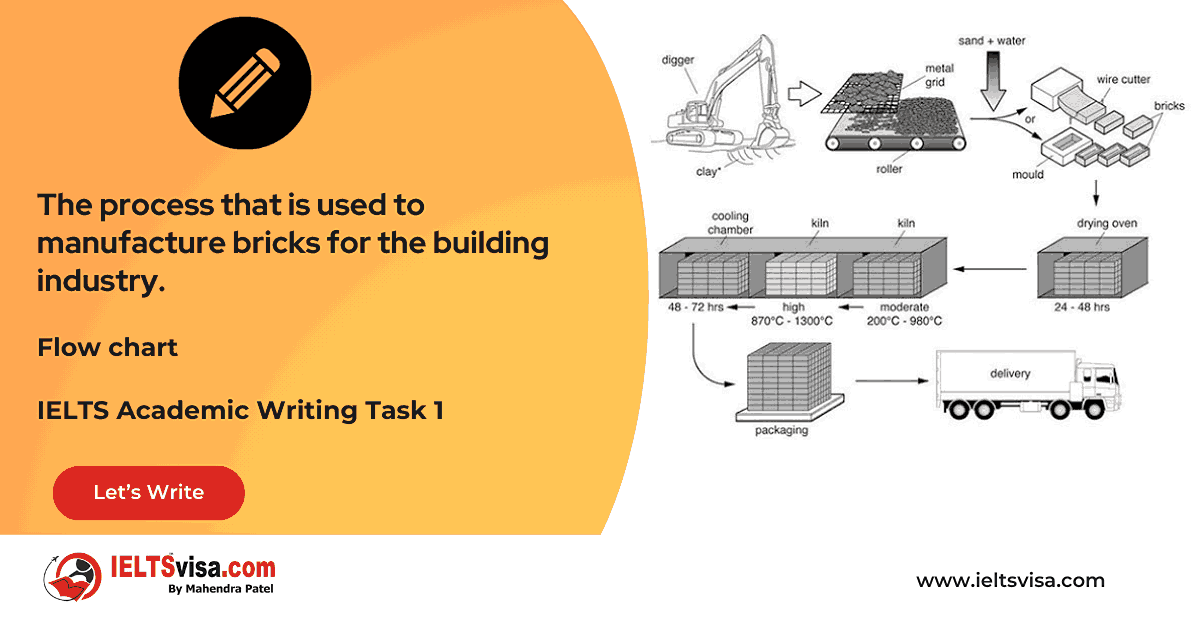
Task 1 – Flow chart -The process that is used to manufacture bricks for the building industry.
20:00 Start Pause Stop [df_adh_heading title_infix="IELTS Writing Task 1 Question" use_divider="on"...
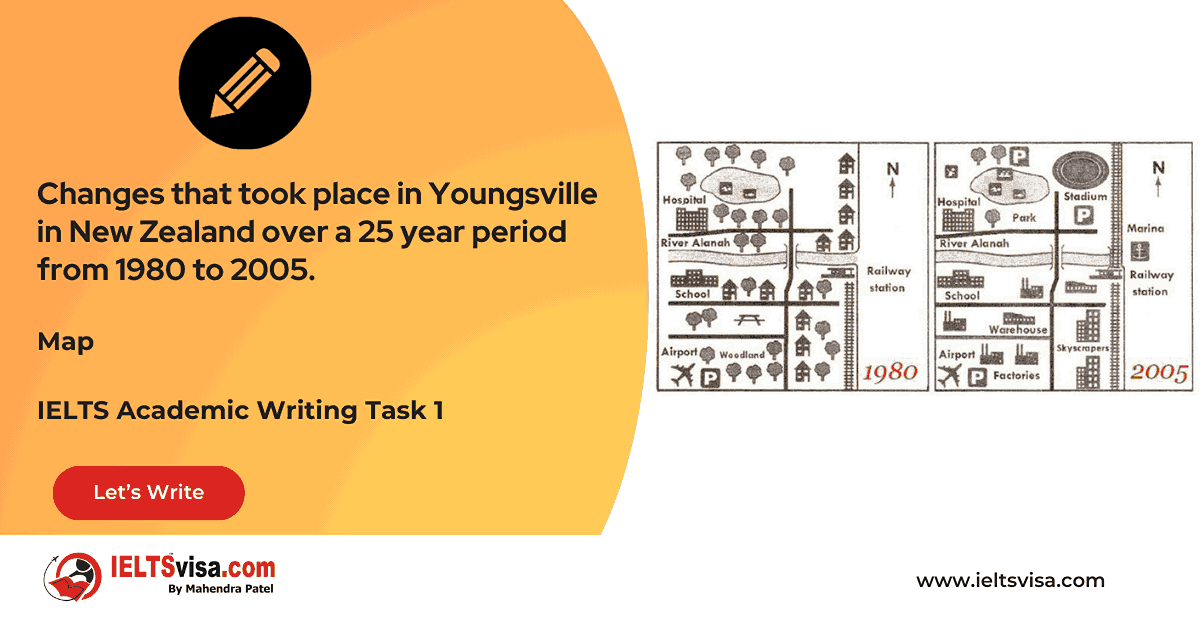
Task 1 – Map – Changes that took place in Youngsville in New Zealand over a 25 year period from 1980 to 2005.
20:00 Start Pause Stop [df_adh_heading title_infix="IELTS Writing Task 1 Question" use_divider="on"...
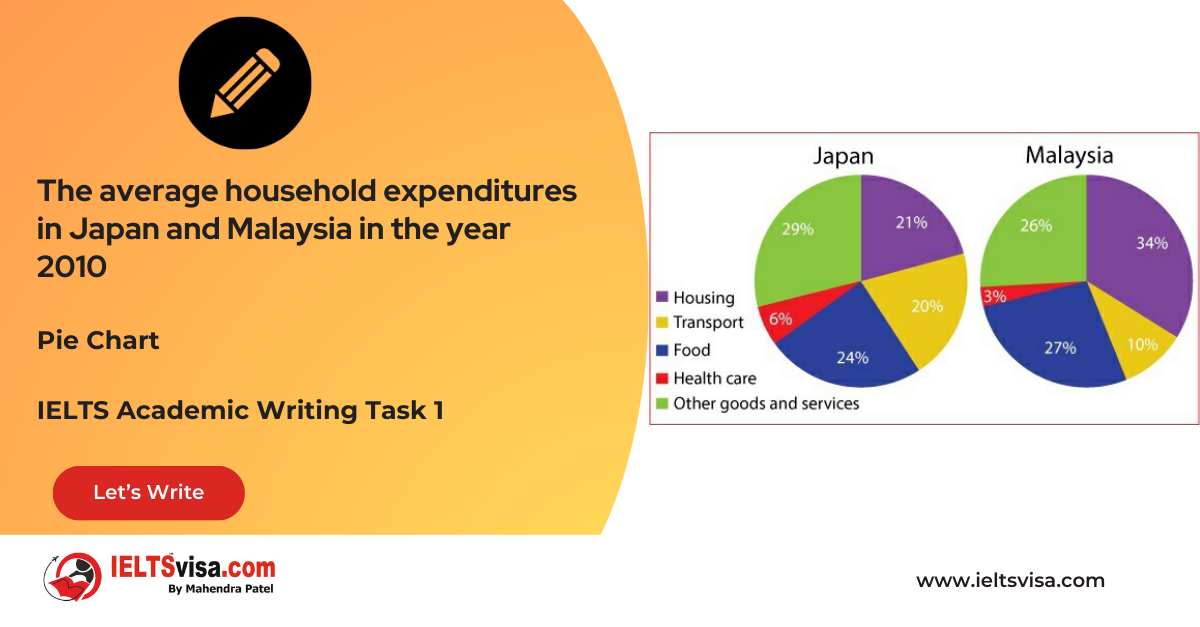
Task 1 – Pie Chart – The average household expenditures in Japan and Malaysia in the year 2010
20:00 Start Pause Stop [df_adh_heading title_infix="IELTS Writing Task 1 Question" use_divider="on"...
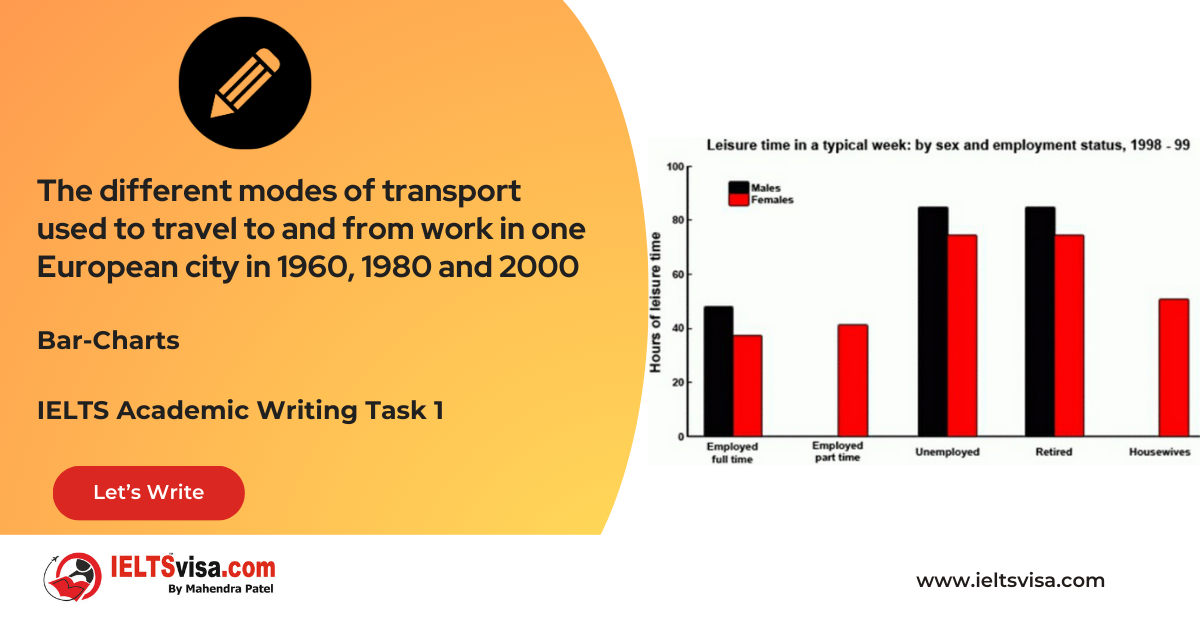
Task 1 – Bar Graph – The different modes of transport used to travel to and from work in one European city in 1960, 1980 and 2000
20:00 Start Pause Stop [df_adh_heading title_infix="IELTS Writing Task 1 Question" use_divider="on"...
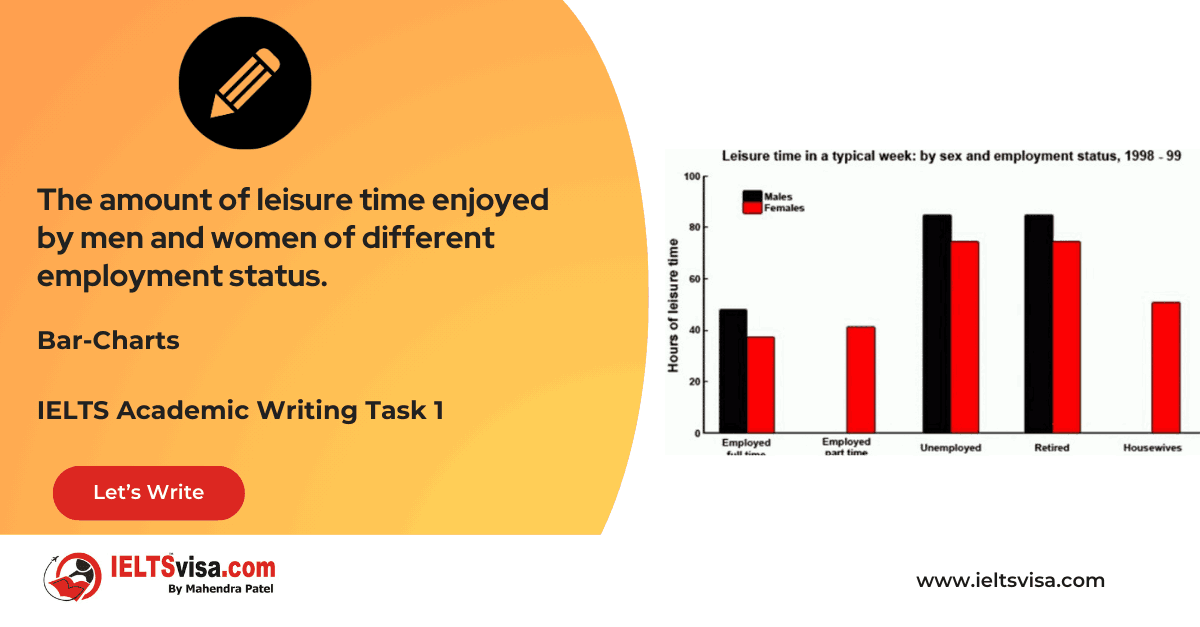
Task 1 – Bar Graph – The amount of leisure time enjoyed by men and women of different employment status
20:00 Start Pause Stop [df_adh_heading title_infix="IELTS Writing Task 1 Question" use_divider="on"...
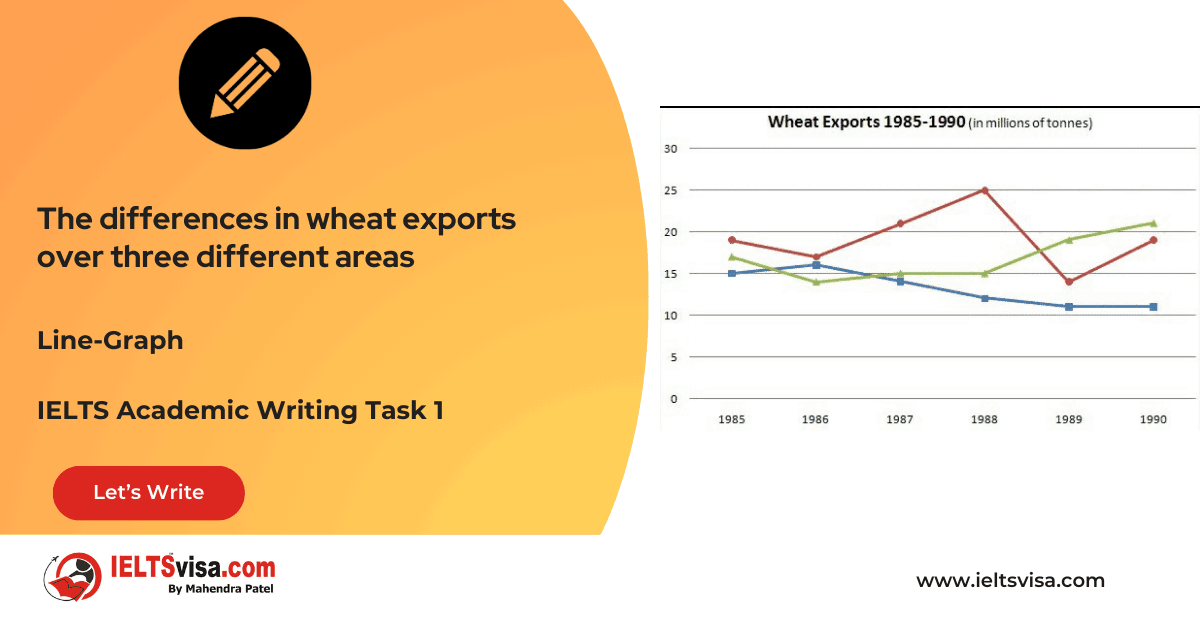
Task 1 – Line Graph – The differences in wheat exports over three different areas
20:00 Start Pause Stop [df_adh_heading title_infix="IELTS Writing Task 1 Question" use_divider="on"...
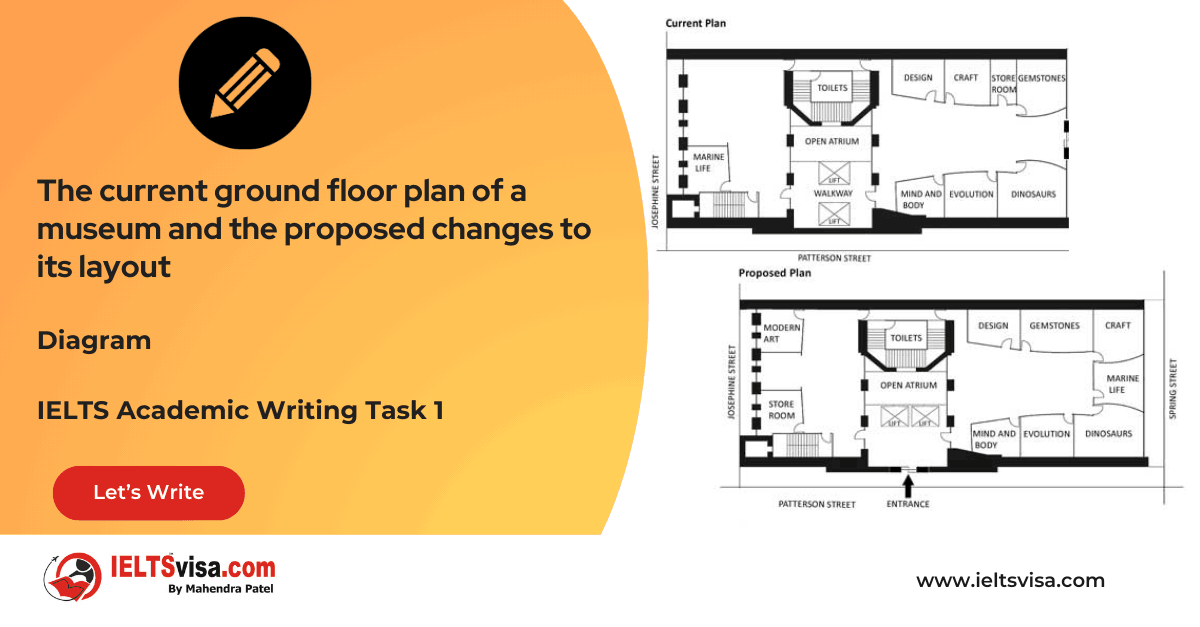
Task 1 – Diagram – The current ground floor plan of a museum and the proposed changes to its layout
20:00 Start Pause Stop [df_adh_heading title_infix="IELTS Writing Task 1 Question" use_divider="on"...

