The total amount of waste produced by cities and towns of six countries in 1980, 1990 and 2000
IELTS Academic Writing Task 1 - Tables
IELTS Writing Task 1 Question
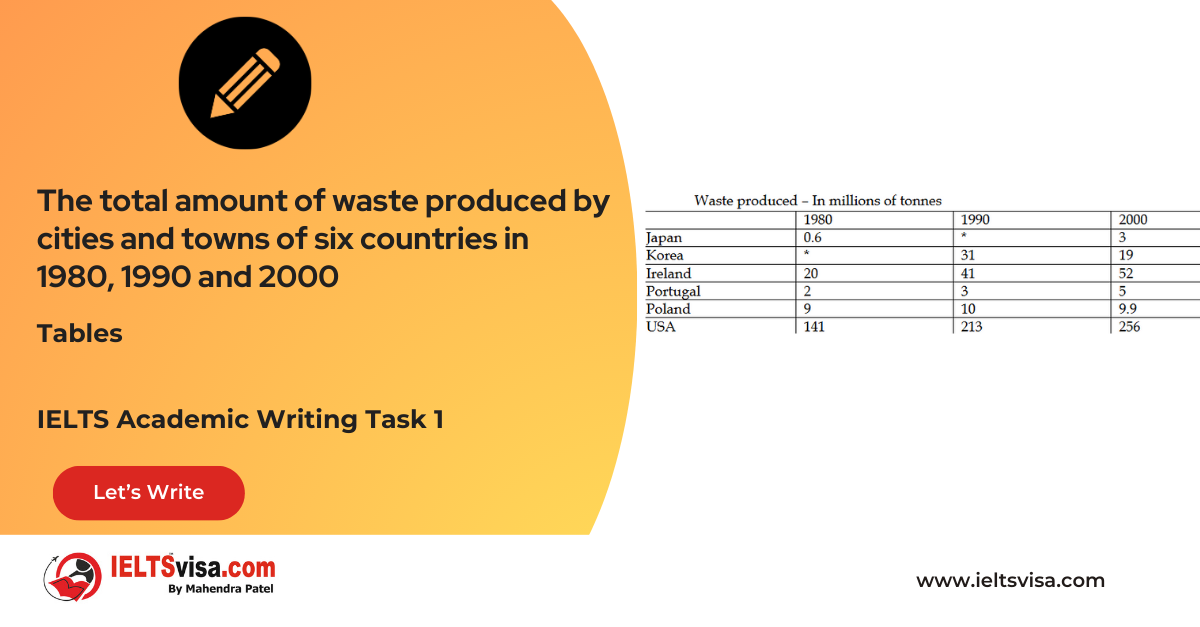
The graph below shows the total amount of waste produced by cities and towns of six countries in 1980, 1990 and 2000. Summarise the information by selecting and reporting the main features and make comparisons where relevant.

Common Questions for Column Graph Data
1. Graph Type: Column graph.
2. Title: Total Amount of Waste Produced by Cities and Towns of Six Countries (1980, 1990, and 2000).
3. What are the units of measurement?: Million tonnes.
4. Who: Cities and towns in Japan, Korea, Ireland, Portugal, Poland, and the USA.
5. When: 1980, 1990, 2000.
6. Where: Six countries (Japan, Korea, Ireland, Portugal, Poland, USA).
7. Topic: The total amount of waste produced by cities and towns in six countries.
Comparison Showing and Trends Any change over time (such as an increase or a decrease) is a trend.
- Details:
- The USA consistently generated the highest waste throughout the period, starting with 141 million tonnes in 1980 and increasing to 213 million tonnes by 1990.
- Japan produced the least waste, starting at 0.6 million tonnes in 1980 and seeing a significant increase to 3 million tonnes by 2000.
- The waste generated in countries like Portugal, Poland, and Ireland showed moderate increases, with sharp increases observed in Ireland between 1980 and 1990.
- Korea’s waste production decreased between 1990 and 2000, while other countries saw either moderate increases or stable waste generation.
Sample Answer
The given graph shows the total amount of waste generated in a million tonnes by cities and towns in six countries—Japan, Korea, Ireland, Portugal, Poland, and the USA—between 1980 and 2000.
Overall, a clear trend emerges: the USA consistently generated the largest amount of waste while Japan remained the lowest waste producer throughout the entire period.
In 1980, Japan produced only 0.6 million tonnes of waste, the lowest among the six countries. The USA, by contrast, generated 141 million tonnes of waste, which was the highest. Over the next decade, waste production increased sharply in Ireland, from 20 million tonnes to 41 million tonnes, and in the USA, from 141 million tonnes to 213 million tonnes. Waste generation in Portugal and Poland grew slightly, while Korea’s data was missing in 1990.
Between 1990 and 2000, waste generation increased moderately in Ireland, Portugal, and the USA, but Korea’s waste production decreased from 31 million tonnes in 1990 to 19 million tonnes in 2000.
Top 27 Vocabularies
| Vocabulary | Meaning | Synonyms | Examples | Type |
| Escalation | A rapid increase or rise | Increase, surge | “There was a sharp escalation in the waste generated by Ireland between 1980 and 1990.” | Noun |
| Profound | Very great or intense | Significant, Substantial | “The decade from 1990 to 2000 did not see such a profound escalation in waste generation.” | Adjective |
| Moderate | Average or medium in amount | Reasonable, mild | “Ireland, Portugal, and the USA saw moderate growth in waste production from 1990 to 2000.” | Adjective |
| Minimal | Very small or insignificant | Slight, negligible | “Portugal and Poland saw minimal increases in waste production from 1980 to 1990.” | Adjective |
| Consistently | In a way that is unchanging or steady | Unchangingly, constantly | “The USA consistently generated the highest amount of waste throughout the period.” | Adverb |
|
Trends |
General directions or patterns of change |
Patterns, tendencies |
“The graph reveals a clear trend in waste generation over the years.” |
Noun |
|
Sharp |
Sudden and intense in degree |
Steep, drastic |
“Waste production in the USA saw a sharp increase between 1980 and 1990.” |
Adjective |
|
Increase |
A rise or growth in amount or level |
Growth, rise |
“Waste generation increased significantly in the USA from 1980 to 1990.” |
Noun |
|
Significant |
Having a noticeable effect or importance |
Notable, considerable |
“The increase in Ireland’s waste production was significant between 1980 and 1990.” |
Adjective |
|
Decline |
A reduction or decrease in amount |
Drop, decrease |
“Korea experienced a decline in waste production from 1990 to 2000.” |
Noun |
|
Data |
Factual information used for analysis |
Information, statistics |
“The data from 1990 showed a decrease in Korea’s waste production.” |
Noun |
|
Sharp increase |
A rapid or steep rise |
Sudden surge, significant jump |
“The sharp increase in waste production was observed in the USA.” |
Noun |
|
Moderate |
Average in size or degree, not extreme |
Reasonable, mild |
“The waste increase in Portugal was moderate between 1980 and 2000.” |
Adjective |
|
Slight |
Small or insignificant in amount or degree |
Minor, small |
“Poland’s waste production saw only slight growth from 1980 to 1990.” |
Adjective |
|
Amount |
A quantity or volume of something |
Quantity, sum |
“The amount of waste produced by Japan remained low over the entire period.” |
Noun |
|
Proportion |
The relationship in size or amount between parts or elements |
Ratio, share |
“The proportion of waste generated by Japan was the lowest.” |
Noun |
|
Generate |
To produce or create |
Create, produce |
“The USA generated the highest amount of waste in 1980.” |
Verb |
|
Consistently |
In a way that remains constant or uniform |
Constantly, unchangingly |
“Ireland consistently saw growth in waste production.” |
Adverb |
|
Rise |
To increase in amount or level |
Increase, climb |
“There was a rise in the amount of waste produced in Portugal in the 1990s.” |
Noun |
|
Sharp rise |
A rapid increase or surge |
Steep increase, rapid growth |
“The sharp rise in waste generation in the USA was striking.” |
Noun |
|
Increase steadily |
To grow gradually and evenly |
Grow smoothly, rise gradually |
“Korea’s waste production increased steadily from 1980 to 1990.” |
Verb |
|
Comparatively |
In relation to something else |
Relatively, in comparison |
“Korea’s waste production was comparatively low in the 1990s.” |
Adverb |
|
Throughout |
Across the entire period or area |
All through, during |
“Japan remained the lowest waste producer throughout the period.” |
Preposition |
|
Period |
A length or span of time |
Duration, interval |
“The period from 1980 to 2000 showed varying levels of waste production.” |
Noun |
|
Chart |
A visual representation of data |
Graph, diagram |
“The chart shows the clear trends in waste production across the countries.” |
Noun |
|
Fluctuate |
To change or vary irregularly |
Vary, change |
“Waste generation fluctuated significantly in several countries.” |
Verb |
|
Substantial |
Of considerable importance or size |
Significant, considerable |
“The increase in waste generation in the USA was substantial.” |
Adjective |


Our Books

Master IELTS Speaking Part 1
IELTS Writing Task 1 Book
IELTS Writing Task 2 Book
Writing Task 1 Question Types
Practice IELTS Other Modules
IELTS Listening
The IELTS Listening test assesses how well you can understand spoken English in various contexts. It lasts about 30 minutes and is divided into four sections with a total of 40 questions. The listening tasks become increasingly difficult as the test progresses.
IELTS Academic Reading
The IELTS Academic Reading section assesses your ability to understand and interpret a variety of texts in academic settings. It is designed to evaluate a range of reading skills, including skimming for gist, reading for main ideas, reading for detail, understanding inferences, and recognizing a writer's opinions and arguments.
IELTS Speaking
The IELTS Speaking test assesses your ability to communicate in English on everyday topics. It lasts 11-14 minutes and consists of three parts: introduction, cue card, and a discussion based on the cue card topic.
IELTS General Reading
IELTS General Reading tests your ability to understand and interpret various types of texts. Here are some key areas and types of content you can expect to encounter in the reading section, along with tips for effective preparation.
IELTS Academic Writing Task 1
In IELTS Academic Writing Task 1, you are presented with a visual representation of information, such as graphs, charts, tables, or diagrams, and you are required to summarize, compare, or explain the data in your own words.
IELTS General Writing Task 1
In IELTS General Writing Task 1, you are required to write a letter based on a given situation. The letter can be formal, semi-formal, or informal, depending on the prompt. Here’s a breakdown of the key components to include in your letter
IELTS Academic Writing Task 2
In IELTS Academic Writing Task 2, you are required to write an essay in response to a question or topic. Here’s a guide to help you understand the essential elements of this task
IELTS Exam Tips
To succeed in the IELTS exam, practice regularly, familiarize yourself with the test format, improve your vocabulary, develop time management skills, and take mock tests to build confidence.
Grammer for IELTS
Grammar is the foundation of effective communication in English. Understanding tense usage, subject-verb agreement, and sentence structure enhances clarity and coherence in writing and speaking.
Vocabulary for IELTS
Vocabulary plays a crucial role in the IELTS (International English Language Testing System) exam, especially in the Speaking and Writing sections. Here’s an overview of why vocabulary is important and how it impacts your performance
RECENT IELTS SAMPLES QUESTIONS AND ANSWERS
Comparison of Males Preferring Watching vs. Participating in Sports
20:00 Start Pause Stop [df_adh_heading title_infix="IELTS Writing Task 1 Question" use_divider="on"...
Task 1 – Line-Bar – The total volume of telephone calls (in million minutes) in Denmark, divided into three categories, from 1995- 2004
20:00 Start Pause Stop [df_adh_heading title_infix="IELTS Writing Task 1 Question" use_divider="on"...
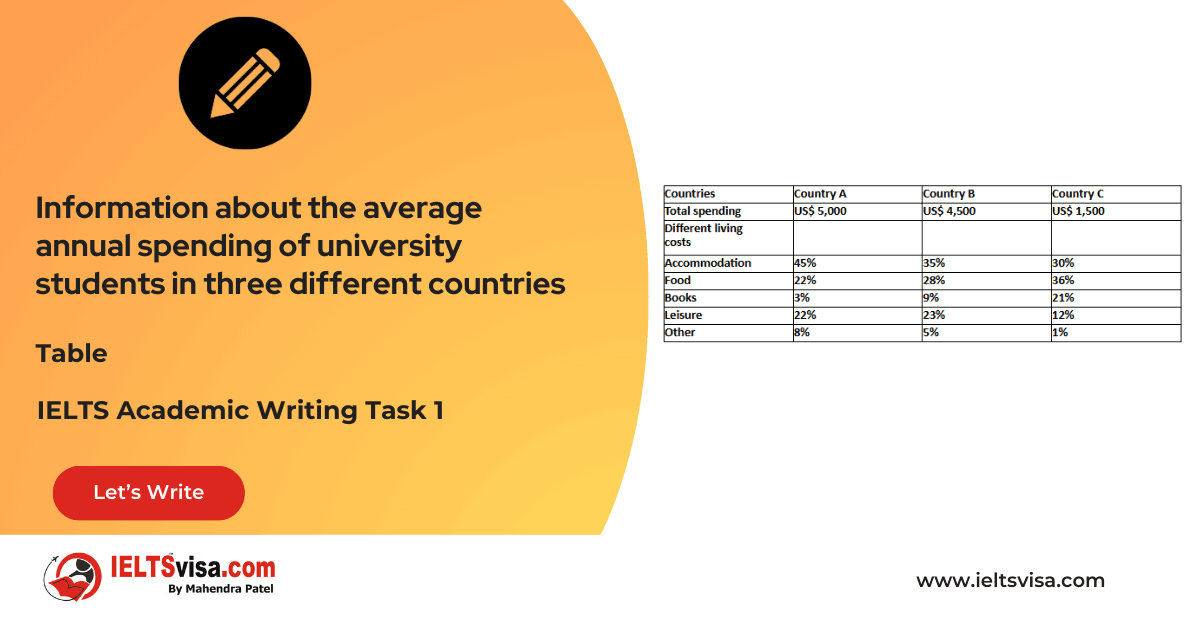
Task 1 – Table – Information about the average annual spending of university students in three different countries
20:00 Start Pause Stop [df_adh_heading title_infix="IELTS Writing Task 1 Question" use_divider="on"...
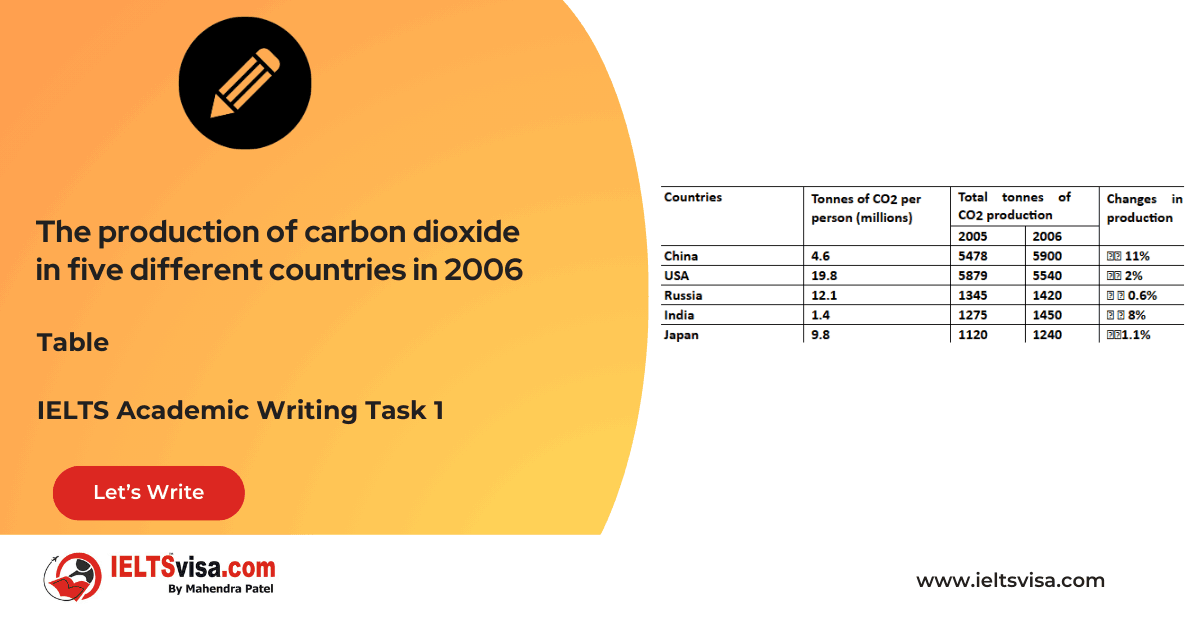
Task 1 – Table -The production of carbon dioxide in five different countries in 2006
20:00 Start Pause Stop [df_adh_heading title_infix="IELTS Writing Task 1 Question" use_divider="on"...
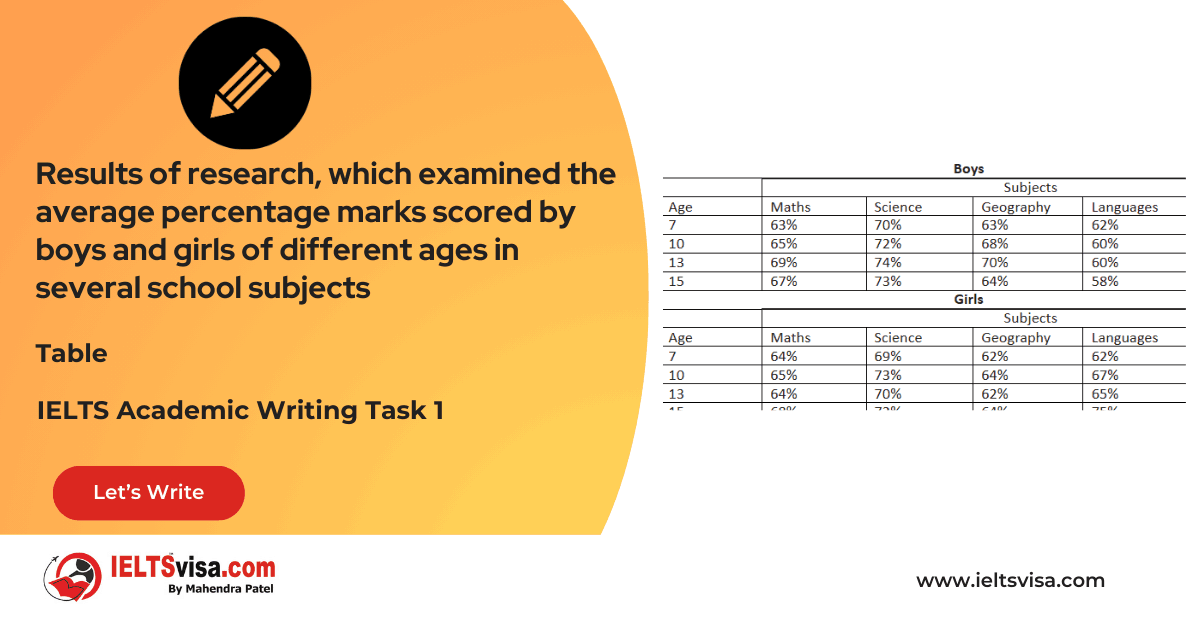
Task 1 – Table – Results of research, which examined the average percentage marks scored by boys and girls of different ages in several school subjects
20:00 Start Pause Stop [df_adh_heading title_infix="IELTS Writing Task 1 Question" use_divider="on"...
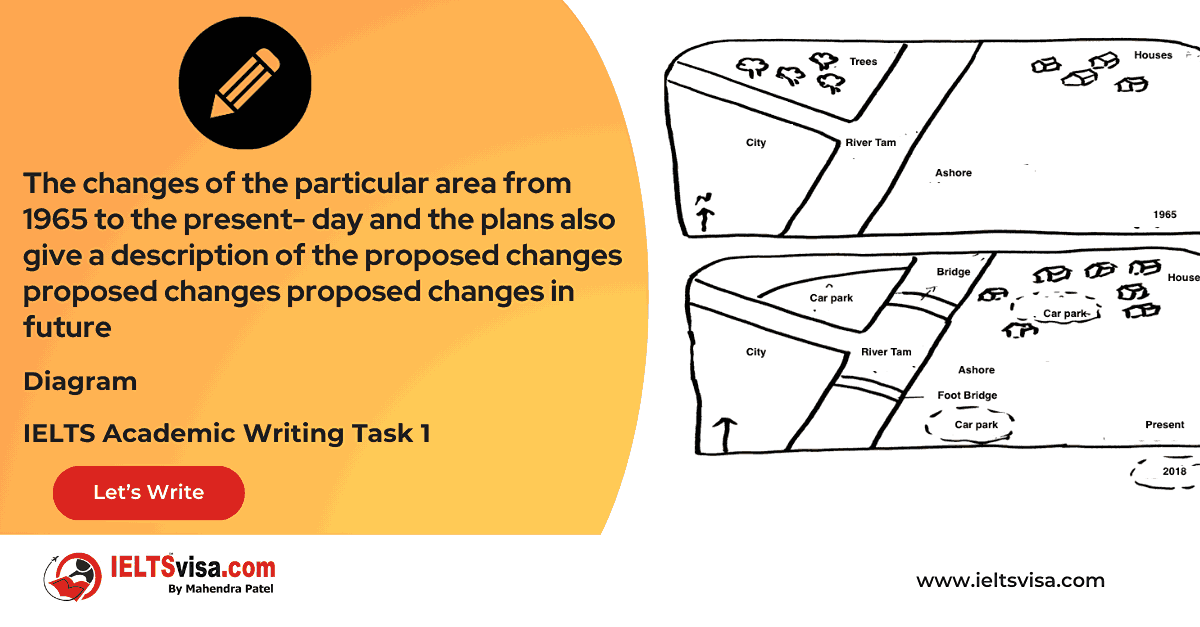
Task 1 – Diagram – The structure of a home smokery and how it works
20:00 Start Pause Stop [df_adh_heading title_infix="IELTS Writing Task 1 Question" use_divider="on"...
Our IT Company Services


