Medical care in three European countries between 1980 and 2000
IELTS Academic Writing Task 1 - Table
IELTS Writing Task 1 Question
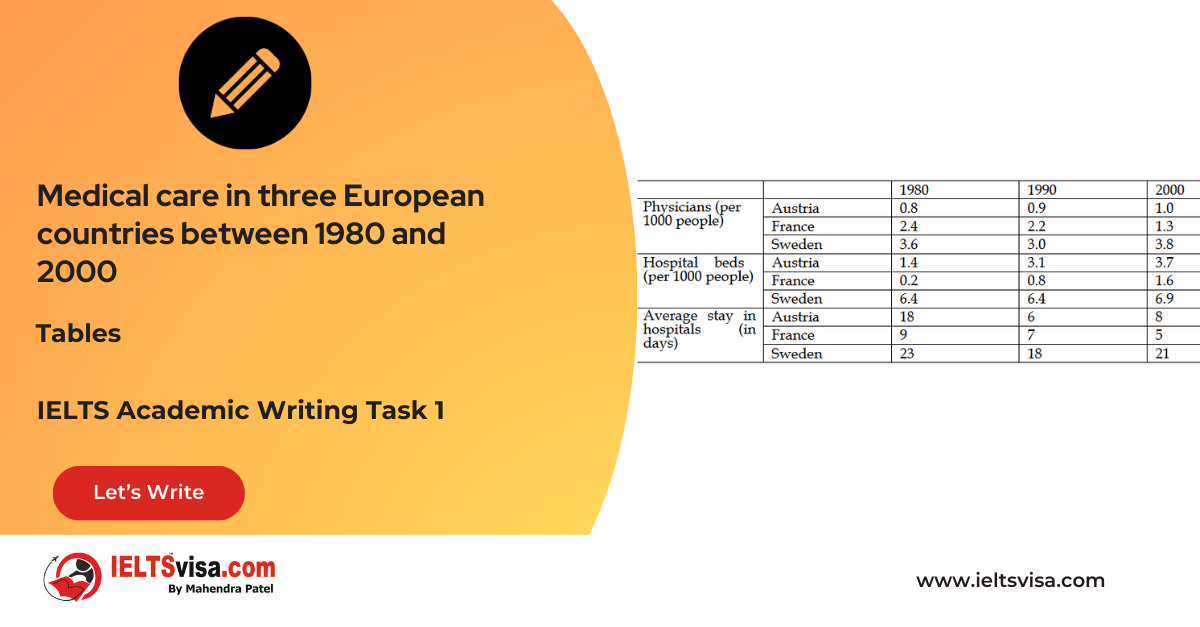
The graph below shows the information about medical care in three European countries between 1980 and 2000.

Common questions for the medical care graph
1. Graph Type: Line graph and table.
2. Title: Medical Care in Austria, France, and Sweden (1980–2000)
3. What are the units of measurement?: Number of doctors per 1,000 people, number of hospital beds per 1,000 people, average stay in hospital (in days).
4. Who: The data compares the healthcare facilities in Austria, France, and Sweden.
5. When: The data spans from 1980 to 2000.
6. Where: The three countries under comparison are Austria, France, and Sweden.
7. Topic: The graph shows changes in medical care aspects like the number of doctors, hospital beds, and average stay in hospitals in these three European countries.
Comparison Showing and Trends
Comparison 1 : Doctors per 1,000 people
- Sweden had the highest number of doctors in 1980, with 3.6 doctors per 1,000 people, although this number dropped to 3.0 in 1990 before increasing again to 3.8 by 2000. Austria’s doctors increased marginally from 0.8 to 1.0 per 1,000 people. In contrast, France experienced a decline, with doctors per 1,000 people decreasing from 2.4 in 1980 to 1.3 by 2000.
Comparison 2 : Hospital Beds per 1,000 people
- Sweden led in hospital beds with 6.4 beds per 1,000 people in 1980 and 1990, and 6.9 by 2000. Austria saw an increase from 1.4 to 3.7 beds per 1,000 people. France showed the most significant growth, from 0.2 beds in 1980 to 1.6 by 2000.
Comparison 3 : Average Stay in Hospital
- Sweden had the highest average hospital stay, maintaining around 20 days across the entire period. Austria’s stay decreased significantly from 18 days in 1980 to 8 days by 2000. France’s average stay in hospital decreased gradually, from 9 days in 1980 to 5 days in 2000.
Sample Answer
The line graph and table compare medical care statistics in Austria, France, and Sweden from 1980 to 2000, focusing on the number of doctors per 1,000 people, the number of hospital beds per 1,000 people, and the average hospital stay.
Overall, Sweden had the best healthcare facilities, while France lagged behind in all areas.
Sweden had the highest number of doctors in 1980, with 3.6 per 1,000 people, although this figure dropped in 1990 before rising again by 2000. Austria’s doctor availability grew slightly from 0.8 to 1.0 per 1,000 people, while France experienced a decrease from 2.4 to 1.3 per 1,000 people over the same period.
In terms of hospital beds, Sweden had the highest number with 6.4 beds per 1,000 people in 1980, and it increased slightly by 2000. Austria’s bed availability increased significantly from 1.4 to 3.7 per 1,000 people. France experienced the most dramatic increase, from just 0.2 to 1.6 beds.
Regarding hospital stays, Sweden had the longest average stay at around 20 days throughout the period. Austria and France saw significant reductions, with Austria’s average stay decreasing from 18 days to 8 days, and France’s from 9 days to 5 days.
Top 25 Vocabulary
| Vocabulary | Meaning | Synonyms | Examples | Type |
| Marginally | To a small extent or degree | Slightly, modestly | “The number of doctors grew marginally in Austria from 0.8 to 1.0 per 1000 people.” | Adverb |
| Marked | Noticeable or significant | Significant, considerable | “Austria saw a marked decrease in the days of hospitalization from 18 to 8.” | Adjective |
| Escalation | A gradual increase or rise | Increase, growth | “France saw the most marked escalation in the number of hospital beds from 0.2 to 1.6.” | Noun |
| Fluctuations | Variations or changes in a pattern | Oscillations, changes | “The number of doctors in Sweden fluctuated between 3.0 and 3.8 per 1000 people.” | Noun |
| Dramatic | Sudden and extreme | Striking, significant | “France showed a dramatic increase in the number of hospital beds per 1000 people.” | Adjective |
| Comparison | The act of examining similarities and differences | Contrast, juxtaposition | “The comparison of doctors per 1,000 people showed significant differences between countries.” | Noun |
| Shift | A change or movement from one position to another | Change, transition | “There was a shift in hospital bed availability between 1980 and 2000.” | Noun |
| Trend | A general direction or tendency | Movement, direction | “The trend shows a steady increase in hospital beds in Austria.” | Noun |
| Surge | A sudden or large increase | Spike, upswing | “There was a surge in the number of hospital beds in France.” | Noun/Verb |
| Steady | Consistent or unchanging over time | Stable, unvarying | “Sweden’s healthcare system remained steady throughout the period.” | Adjective |
| Exponential | Increasing at a very rapid rate | Rapid, accelerating | “Austria’s number of hospital beds increased exponentially.” | Adjective |
| Proportion | A part or share of a whole | Fraction, segment | “The proportion of doctors per 1,000 people in Sweden remained high.” | Noun |
| Consistently | In a consistent manner, without significant change | Regularly, steadily | “Sweden’s hospital stays remained consistently high.” | Adverb |
| Decline | A decrease in quantity or quality | Decrease, drop | “France saw a decline in the number of doctors per 1,000 people.” | Verb |
| Exceed | To surpass or go beyond | Outstrip, surpass | “Sweden’s number of doctors exceeded that of Austria and France.” | Verb |
| Reversal | A complete change in direction or position | Change, turnaround | “Austria experienced a reversal in the number of hospital beds.” | Noun |
| Increase | To become larger or greater in number | Rise, grow | “The number of hospital beds increased significantly in France.” | Verb |
| Subsequent | Occurring after something else | Following, ensuing | “In the subsequent years, Austria improved its healthcare facilities.” | Adjective |
| Tapered | To gradually decrease or become smaller | Diminish, lessen | “The number of hospital stays tapered off in both Austria and France.” | Verb |
| Enhanced | Improved or made better | Improved, upgraded | “Sweden enhanced its healthcare system by increasing doctor availability.” | Adjective |
| Noteworthy | Worth paying attention to; significant | Remarkable, significant | “The noteworthy increase in hospital beds in France was remarkable.” | Adjective |
| Proliferation | Rapid increase or spread | Expansion, growth | “There was a proliferation of hospital beds in Austria during the 1980s.” | Noun |
| Sustained | Maintained at a constant or continuous level | Continuous, steady | “Sweden’s number of doctors was sustained at a high level throughout the period.” | Adjective |
| Adaptation | Adjustment or modification to meet new conditions | Adjustment, change | “The adaptation of the healthcare system in Austria was crucial to meeting demand.” | Noun |
| Variation | A change or difference in condition or amount | Difference, fluctuation | “The variation in hospital stay durations reflected healthcare changes.” | Noun |


Our Books

Master IELTS Speaking Part 1
IELTS Writing Task 1 Book
IELTS Writing Task 2 Book
Writing Task 1 Question Types
Practice IELTS Other Modules
IELTS Listening
The IELTS Listening test assesses how well you can understand spoken English in various contexts. It lasts about 30 minutes and is divided into four sections with a total of 40 questions. The listening tasks become increasingly difficult as the test progresses.
IELTS Academic Reading
The IELTS Academic Reading section assesses your ability to understand and interpret a variety of texts in academic settings. It is designed to evaluate a range of reading skills, including skimming for gist, reading for main ideas, reading for detail, understanding inferences, and recognizing a writer's opinions and arguments.
IELTS Speaking
The IELTS Speaking test assesses your ability to communicate in English on everyday topics. It lasts 11-14 minutes and consists of three parts: introduction, cue card, and a discussion based on the cue card topic.
IELTS General Reading
IELTS General Reading tests your ability to understand and interpret various types of texts. Here are some key areas and types of content you can expect to encounter in the reading section, along with tips for effective preparation.
IELTS Academic Writing Task 1
In IELTS Academic Writing Task 1, you are presented with a visual representation of information, such as graphs, charts, tables, or diagrams, and you are required to summarize, compare, or explain the data in your own words.
IELTS General Writing Task 1
In IELTS General Writing Task 1, you are required to write a letter based on a given situation. The letter can be formal, semi-formal, or informal, depending on the prompt. Here’s a breakdown of the key components to include in your letter
IELTS Academic Writing Task 2
In IELTS Academic Writing Task 2, you are required to write an essay in response to a question or topic. Here’s a guide to help you understand the essential elements of this task
IELTS Exam Tips
To succeed in the IELTS exam, practice regularly, familiarize yourself with the test format, improve your vocabulary, develop time management skills, and take mock tests to build confidence.
Grammer for IELTS
Grammar is the foundation of effective communication in English. Understanding tense usage, subject-verb agreement, and sentence structure enhances clarity and coherence in writing and speaking.
Vocabulary for IELTS
Vocabulary plays a crucial role in the IELTS (International English Language Testing System) exam, especially in the Speaking and Writing sections. Here’s an overview of why vocabulary is important and how it impacts your performance
RECENT IELTS SAMPLES QUESTIONS AND ANSWERS

Task 1 – Diagram – A conference hall built in 1981 and planned for 2020
20:00 Start Pause Stop [df_adh_heading title_infix="IELTS Writing Task 1 Question" use_divider="on"...
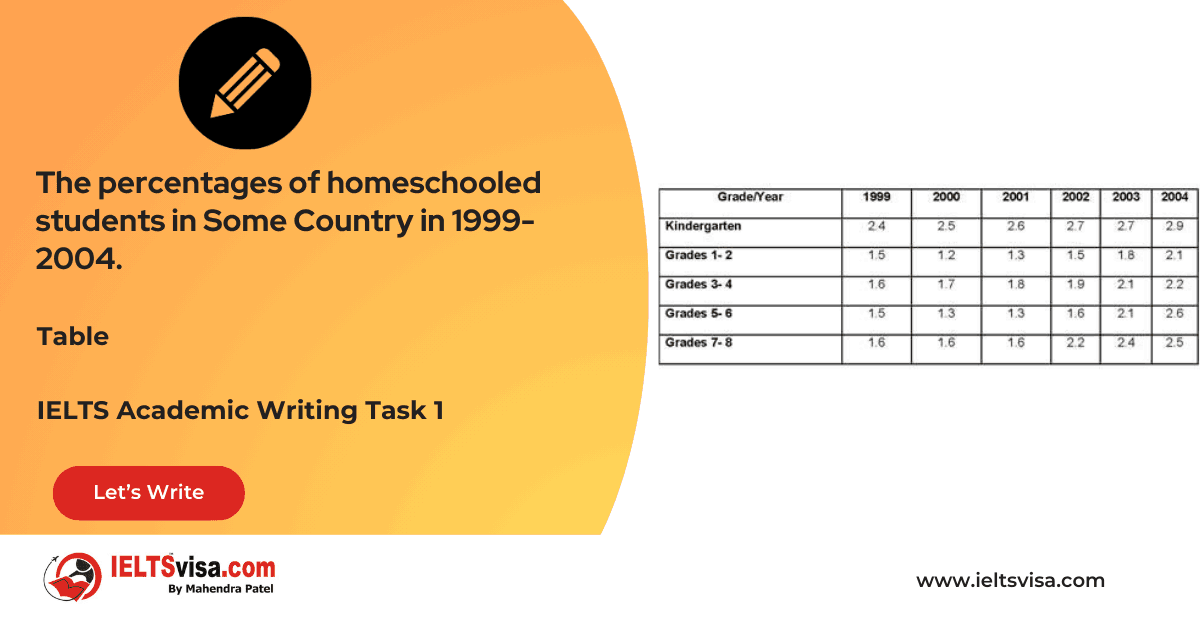
Task 1 – Table – The percentages of homeschooled students in Some Country in 1999-2004.
20:00 Start Pause Stop [df_adh_heading title_infix="IELTS Writing Task 1 Question" use_divider="on"...

Task 1 – Table – For a university tutor describing the information shown.
20:00 Start Pause Stop [df_adh_heading title_infix="IELTS Writing Task 1 Question" use_divider="on"...
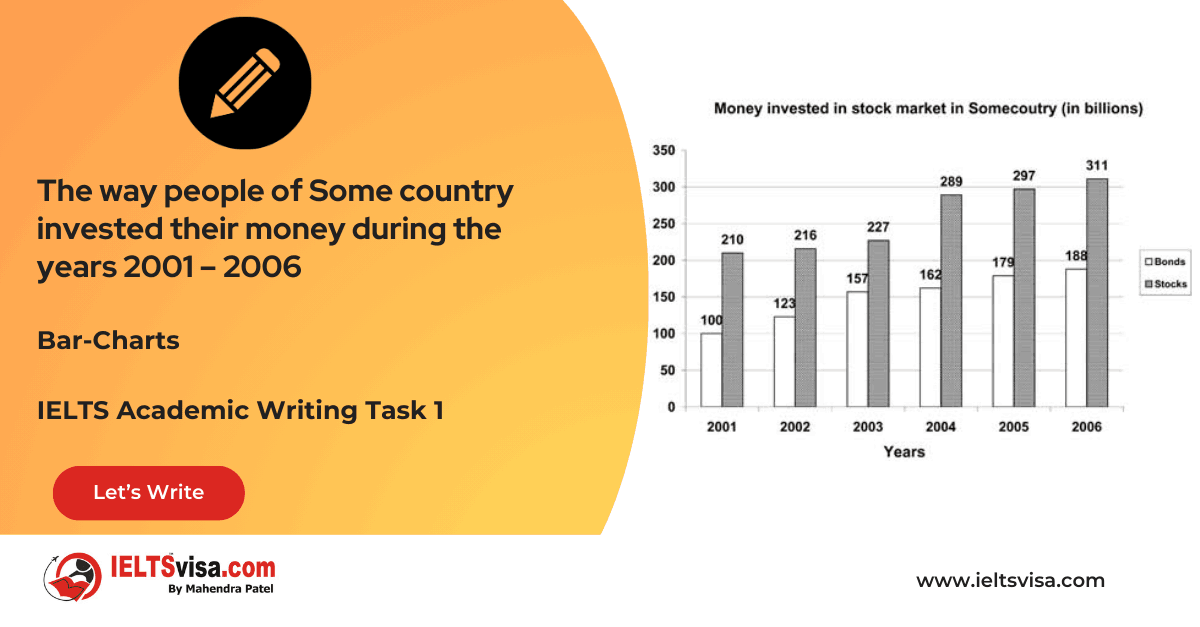
Task 1 – Bar-Charts – The way people of Some country invested their money during the years 2001 – 2006
20:00 Start Pause Stop [df_adh_heading title_infix="IELTS Writing Task 1 Question" use_divider="on"...

Task 1 – Diagram – Rainwater Harvesting and Conversion to Drinking Water in an Australian Town.
20:00 Start Pause Stop [df_adh_heading title_infix="IELTS Writing Task 1 Question" use_divider="on"...

Task 1 – Column graph – Percentage of Young People Enrolled in Universities in 2000 and 2007.
20:00 Start Pause Stop [df_adh_heading title_infix="IELTS Writing Task 1 Question" use_divider="on"...
Our IT Company Services


