Percentage of Pollutants Entering a Section of Ocean in 1997 and 2007
IELTS Academic Writing Task 1 - Pie Charts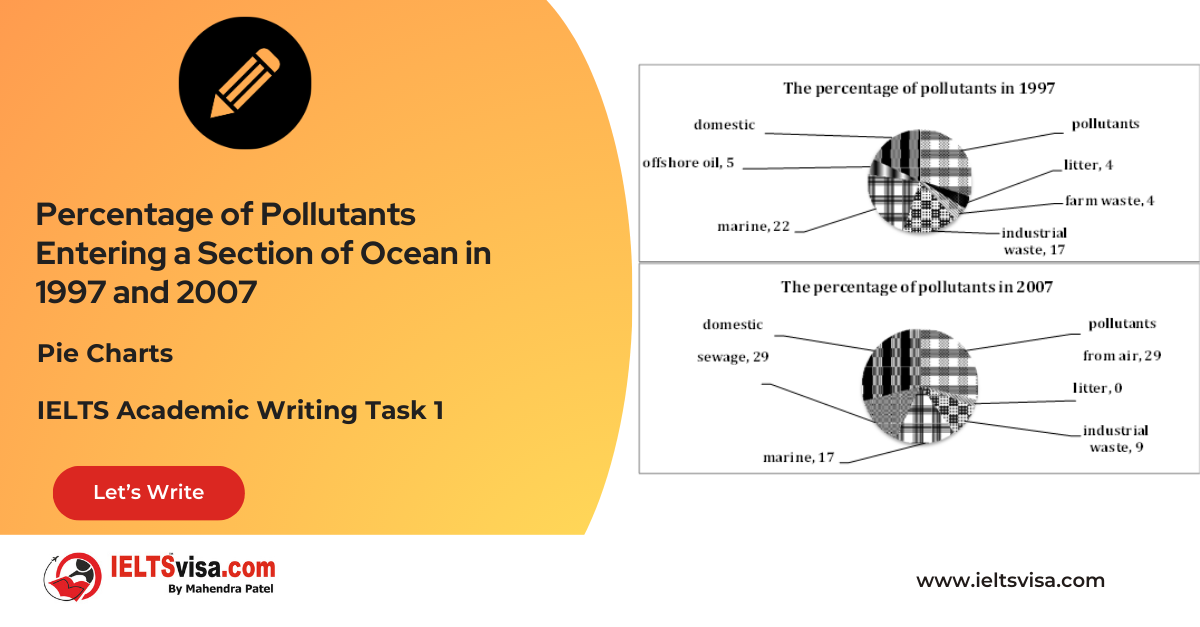
IELTS Writing Task 1 Question
111. The two pie charts show the percentage of pollutants entering a particular part of ocean in 1997 and 2007.

Common questions for the pie charts
1. Graph Type: Pie Charts
2. Title: Percentage of Pollutants Entering a Section of Ocean in 1997 and 2007
3. What are the units of measurement?: Percentage
4. Who: Sources of pollutants entering a section of the ocean
5. When: 1997 and 2007
6. Where: A particular section of the ocean
7. Topic: Distribution of pollutants from various sources over a decade
Process Showing and Trends
Comparison 1 : 1997 pollutants
• Details:
1. The largest sources were air pollutants (30%) and domestic sewage (18%).
2. Offshore oil contributed 5%, and litter was at 4%.
3. Farm waste and marine activities had a minor share, at 4% and 17%, respectively.
Comparison 2 : 2007 pollutants
• Details:
1. Significant increase in domestic sewage, rising to 29%.
2. Offshore oil rose to 14%, nearly threefold compared to 1997.
3. Pollution from air remained stable at around 30%.
4. Decreases were observed in industrial waste (from 20% to 12%) and marine activities (from 17% to 12%).
5. Farm waste fell to 2%, and litter was no longer present.
Sample Answer
The two pie charts illustrate the distribution of pollutants entering a specific ocean region in 1997 and 2007.
In 1997, air pollutants were the major contributor at 30%, closely followed by domestic sewage (18%) and industrial waste (20%). Marine activities accounted for 17%, and smaller percentages came from offshore oil (5%), farm waste (4%), and litter (4%).
By 2007, notable changes were evident. Domestic sewage increased significantly to 29%, and offshore oil pollution saw a substantial rise to 14%. The proportion of pollutants from the air remained consistent at about 30%. Conversely, industrial waste and marine activities both experienced decreases, falling to 12% each. Farm waste declined by half, reaching 2%, and litter disappeared entirely from the recorded pollutants.
Overall, the most significant changes over the ten-year period were the increase in pollution from domestic sewage and offshore oil, while industrial and marine waste contributions decreased. The data highlight shifts in pollution sources affecting this part of the ocean between 1997 and 2007
Top 29 Vocabularies
| Vocabulary | Meaning | Synonyms | Examples |
Type |
|
Contributor |
A source or cause of something |
Source, factor |
“Air pollutants were the major contributor in 1997.” |
Noun |
|
Substantial |
Significant in amount |
Considerable, notable |
“Offshore oil pollution saw a substantial rise by 2007.” |
Adjective |
|
Consistent |
Remaining the same over a period |
Unchanging, steady |
“The proportion of air pollution remained consistent over the decade.” |
Adjective |
|
Decline |
To decrease or reduce |
Drop, decrease |
“Industrial waste saw a decline from 20% to 12%.” |
Verb |
|
Highlight |
To emphasize or point out |
Emphasize, showcase |
“The data highlight shifts in pollution sources over the years.” |
Verb |
|
Illustrate |
To explain or clarify something using examples or visuals |
Demonstrate, depict |
“The charts illustrate the pollution distribution.” |
Verb |
|
Distribution |
The way in which something is spread or shared |
Allocation, dispersal |
“The distribution of pollutants changed over time.” |
Noun |
|
Pollutant |
A substance that contaminates the environment |
Contaminant, impurity |
“Air pollutants were a major source in 1997.” |
Noun |
|
Marine |
Related to the sea or ocean |
Oceanic, aquatic |
“Marine activities contributed to pollution levels.” |
Adjective |
|
Offshore |
Situated at sea but near land |
Coastal, maritime |
“Offshore oil pollution increased significantly.” |
Adjective |
|
Proportion |
A part or share of a whole |
Percentage, fraction |
“The proportion of industrial waste declined by 2007.” |
Noun |
|
Evident |
Clearly seen or understood |
Obvious, noticeable |
“Notable changes were evident between 1997 and 2007.” |
Adjective |
|
Significant |
Important or notable |
Substantial, considerable |
“There was a significant rise in domestic sewage.” |
Adjective |
|
Reduction |
The act of making something smaller in amount |
Decrease, decline |
“Marine activities saw a reduction in pollution levels.” |
Noun |
|
Contribution |
The act of adding or supplying something |
Input, addition |
“Industrial waste made a smaller contribution in 2007.” |
Noun |
|
Environmental |
Relating to the surroundings or ecosystem |
Ecological, natural |
“Pollution impacts the environmental balance of oceans.” |
Adjective |
|
Notable |
Worthy of attention or importance |
Remarkable, noteworthy |
“Offshore oil saw a notable increase over the years.” |
Adjective |
|
Steady |
Regular, constant, or stable |
Consistent, unchanging |
“Air pollution levels remained steady across the years.” |
Adjective |
|
Emerge |
To come into view or become apparent |
Appear, develop |
“New sources of pollution began to emerge.” |
Verb |
|
Increase |
To become greater in size or amount |
Rise, grow |
“There was a sharp increase in offshore oil pollution.” |
Verb |
|
Decline |
A gradual decrease or reduction |
Drop, fall |
“Farm waste pollution declined by half over the years.” |
Noun/Verb |
|
Disappearance |
The act of something ceasing to exist or be visible |
Vanishing, extinction |
“Litter pollution saw complete disappearance in 2007.” |
Noun |
|
Fluctuate |
To change irregularly |
Vary, oscillate |
“Pollutant levels fluctuated over the decade.” |
Verb |
|
Comparison |
The act of evaluating similarities and differences |
Contrast, evaluation |
“A comparison of the data shows pollution trends.” |
Noun |
|
Trend |
A general direction in which something is developing |
Pattern, tendency |
“A downward trend was seen in industrial waste levels.” |
Noun |
|
Majority |
More than half of something |
Bulk, most |
“The majority of pollutants came from air sources.” |
Noun |
|
Minor |
Of lesser importance or smaller in size |
Slight, small |
“Farm waste played a minor role in pollution levels.” |
Adjective |
|
Contamination |
The process of making something impure |
Pollution, infection |
“Water contamination increased due to sewage discharge.” |
Noun |
|
Impact |
The effect or influence of one thing on another |
Effect, consequence |
“The impact of offshore oil pollution was substantial.” |
Noun |


Our Books

Master IELTS Speaking Part 1
IELTS Writing Task 1 Book
IELTS Writing Task 2 Book
Practice IELTS Other Modules
IELTS Listening
The IELTS Listening test assesses how well you can understand spoken English in various contexts. It lasts about 30 minutes and is divided into four sections with a total of 40 questions. The listening tasks become increasingly difficult as the test progresses.
IELTS Academic Reading
The IELTS Academic Reading section assesses your ability to understand and interpret a variety of texts in academic settings. It is designed to evaluate a range of reading skills, including skimming for gist, reading for main ideas, reading for detail, understanding inferences, and recognizing a writer's opinions and arguments.
IELTS Speaking
The IELTS Speaking test assesses your ability to communicate in English on everyday topics. It lasts 11-14 minutes and consists of three parts: introduction, cue card, and a discussion based on the cue card topic.
IELTS General Reading
IELTS General Reading tests your ability to understand and interpret various types of texts. Here are some key areas and types of content you can expect to encounter in the reading section, along with tips for effective preparation.
IELTS Academic Writing Task 1
In IELTS Academic Writing Task 1, you are presented with a visual representation of information, such as graphs, charts, tables, or diagrams, and you are required to summarize, compare, or explain the data in your own words.
IELTS General Writing Task 1
In IELTS General Writing Task 1, you are required to write a letter based on a given situation. The letter can be formal, semi-formal, or informal, depending on the prompt. Here’s a breakdown of the key components to include in your letter
IELTS Academic Writing Task 2
In IELTS Academic Writing Task 2, you are required to write an essay in response to a question or topic. Here’s a guide to help you understand the essential elements of this task
IELTS Exam Tips
To succeed in the IELTS exam, practice regularly, familiarize yourself with the test format, improve your vocabulary, develop time management skills, and take mock tests to build confidence.
Grammer for IELTS
Grammar is the foundation of effective communication in English. Understanding tense usage, subject-verb agreement, and sentence structure enhances clarity and coherence in writing and speaking.
Vocabulary for IELTS
Vocabulary plays a crucial role in the IELTS (International English Language Testing System) exam, especially in the Speaking and Writing sections. Here’s an overview of why vocabulary is important and how it impacts your performance
RECENT IELTS SAMPLES QUESTIONS AND ANSWERS

Task 1 – Column graph – Percentage of Young People Enrolled in Universities in 2000 and 2007.
20:00 Start Pause Stop [df_adh_heading title_infix="IELTS Writing Task 1 Question" use_divider="on"...
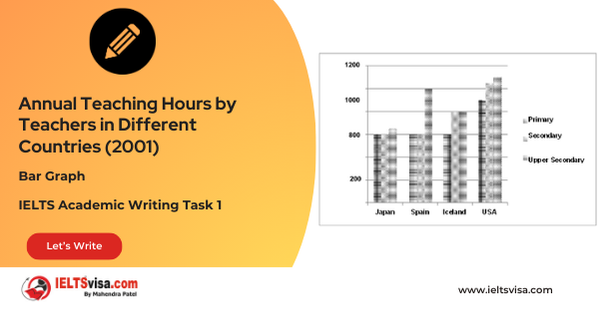
Task 1 – Bar Graph – Annual Teaching Hours by Teachers in Different Countries (2001)
20:00 Start Pause Stop [df_adh_heading title_infix="IELTS Writing Task 1 Question" use_divider="on"...
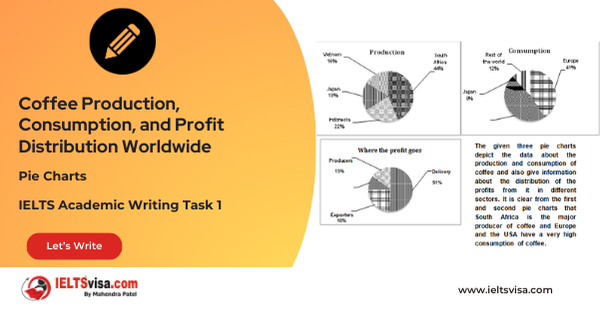
Task 1 – Pie Charts – Coffee Production, Consumption, and Profit Distribution Worldwide
20:00 Start Pause Stop [df_adh_heading title_infix="IELTS Writing Task 1 Question" use_divider="on"...

Task 1 – Column graph – Types of Transport Used by Tourists Visiting New Zealand from Five Countries in 2004.
20:00 Start Pause Stop [df_adh_heading title_infix="IELTS Writing Task 1 Question" use_divider="on"...
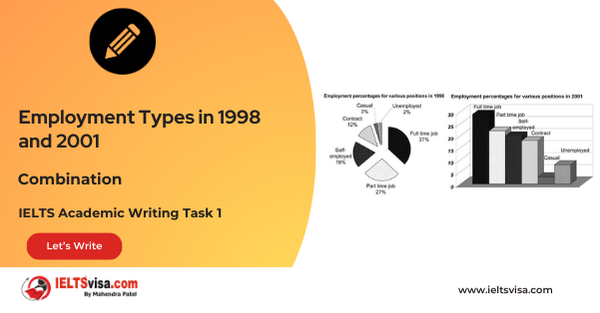
Task 1 – Bar and Pie Chart Combination – Employment Types in 1998 and 2001
20:00 Start Pause Stop [df_adh_heading title_infix="IELTS Writing Task 1 Question" use_divider="on"...

Task 1 – Diagram – Comparison of Stone Tool Development Over Time
20:00 Start Pause Stop [df_adh_heading title_infix="IELTS Writing Task 1 Question" use_divider="on"...
Our IT Company Services


