The population size, birth rate and the death rate of England and Wales from 1700 to 2000
IELTS Academic Writing Task 1 - LineGraph
IELTS Writing Task 1 Question
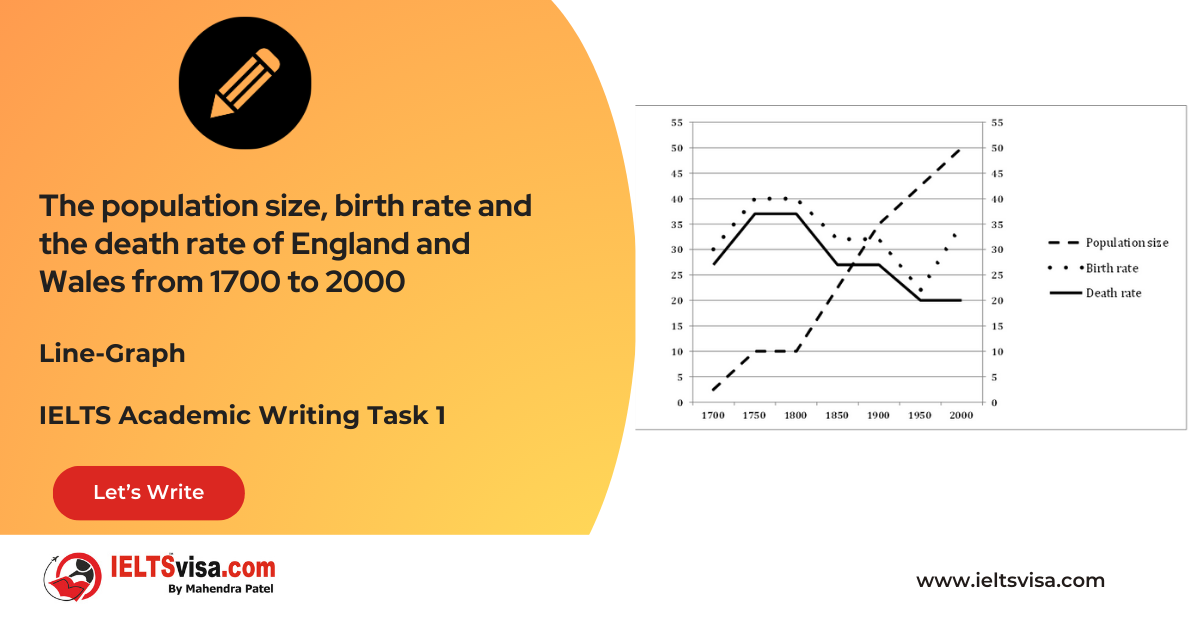
The line graph below shows the population size, birth rate and the death rate of England and Wales from 1700 to 2000. Summarise the information by selecting and reporting the main features and make comparisons where relevant.

Common Questions for the Line Graph
1. Graph Type: Line Graph
2. Title: Population Size, Birth Rate, and Death Rate of England and Wales (1700-2000)
3. Units of Measurement: Population in millions; Birth and Death Rates per 1,000 people
4. Who: Population of England and Wales
5. When: 1700 to 2000
6. Where: England and Wales
7. Topic: Trends in population size, birth rate, and death rate over 300 years
Comparison Showing and Trends Any change over time (such as an increase or a decrease) is a trend.
Comparison 1 : Population Size
- Details:
-
- The population increased dramatically from 2.5 million in 1700 to 50 million in 2000.
2. A period of stability occurred between 1750 and 1800.
Comparison 2: Birth and Death Rates (1700-1950)
-
Details:
1. Both rates rose between 1700 and 1750 (birth rate: 30 to 40; death rate: 27 to 37 per 1,000 people).
2. Stability was observed for the next 50 years.
3. Both rates declined sharply, reaching an all-time low of around 20 per 1,000 people by 1950.
Comparison 3 : Birth and Death Rates (1950-2000)
Details:
- The death rate remained stable at approximately 20 per 1,000 people.
- The birth rate increased dramatically from 22 to 35 per 1,000 people.
Sample Answer
The line graph illustrates the population size and compares England and Wales’s birth and death rates over 300 years, from 1700 to 2000.
Overall, the population grew significantly throughout the period, while both birth and death rates fluctuated. The birth rate showed a marked increase toward the end of the period, whereas the death rate remained stable after 1950.
From 1700 to 1750, both birth and death rates increased, with the birth rate rising from 30 to 40 per 1,000 people and the death rate climbing from 27 to 37 per 1,000 people. Stability characterised the next 50 years, but from 1800 to 1950, both rates declined sharply, reaching approximately 20 per 1,000 people.
Between 1950 and 2000, the death rate stabilised at around 20 per 1,000 people. In contrast, the birth rate surged from 22 to 35 per 1,000 people, diverging from earlier trends. Over the same period, the population size rose dramatically from 2.5 million in 1700 to 50 million in 2000, despite a short plateau from 1750 to 1800.
Top 27 Vocabularies
| Vocabulary | Type | Meaning | Synonyms | Examples |
|
Mortality |
Noun |
Death rate in a population |
Fatality, death toll |
“The mortality rate stabilized after 1950.” |
|
Stability |
Noun |
The state of being steady and unchanging |
Constancy, steadiness |
“A period of stability was observed from 1750 to 1800.” |
|
Escalation |
Noun |
A rapid increase in amount or extent |
Surge, growth |
“The 300 years saw a dramatic escalation in population.” |
|
Dramatic |
Adjective |
Noticeable and significant |
Striking, substantial |
“The dramatic rise in birth rate after 1950 was notable.” |
|
Plateau |
Noun |
A period of little or no change |
Leveling, flat phase |
“The population showed a short plateau from 1750 to 1800.” |
|
Illustrates |
Verb |
To explain or make clear with examples or visuals |
Depicts, Shows |
“The line graph illustrates population trends over 300 years.” |
|
Fluctuated |
Verb |
To change frequently and unpredictably |
Vary, Shifted |
“The birth and death rates fluctuated over the years.” |
|
Marked |
Adjective |
Noticeable or clearly significant |
Pronounced, Distinct |
“The birth rate showed a marked increase toward the end of the period.” |
|
Stable |
Adjective |
Unchanging, steady, or consistent over time |
Steady, Constant |
“The death rate remained stable after 1950.” |
|
Climbed |
Verb |
To increase or rise in a gradual or steady manner |
Increased, Rose |
“The birth rate climbed from 30 to 40 per 1,000 people.” |
|
Characterised |
Verb |
To describe or define the qualities or features of something |
Defined, Described |
“Stability characterised the next 50 years.” |
|
Diverging |
Verb |
Moving or developing in different directions |
Separating, Departing |
“The birth rate surged, diverging from earlier trends.” |
|
Surged |
Verb |
To rise or increase suddenly and significantly |
Soared, Spiked |
“The birth rate surged from 22 to 35 per 1,000 people.” |
|
Sharp |
Adjective |
Sudden and intense in change or movement |
Steep, Sudden |
“Both rates declined sharply from 1800 to 1950.” |
|
Reaching |
Verb |
To arrive at or attain a particular level or point |
Attaining, Hitting |
“The birth rate reached approximately 20 per 1,000 people in 1800.” |
|
Declined |
Verb |
To decrease or reduce over time |
Dropped, Reduced |
“The death rate declined sharply between 1800 and 1950.” |
|
Period |
Noun |
A specific duration of time |
Interval, Span |
“From 1800 to 1950, both birth and death rates declined.” |
|
Surpassing |
Verb |
To exceed or go beyond a certain limit or level |
Exceeding, Outdoing |
“The population size surpassed 50 million by 2000.” |
|
Demonstrating |
Verb |
Showing clearly or proving something |
Illustrating, Displaying |
“The data demonstrated a significant rise in population size.” |
|
Shifted |
Verb |
Moved or changed in position or direction |
Changed, Altered |
“The birth rate shifted dramatically after 1950.” |
|
Rise |
Noun/Verb |
A steady or gradual increase |
Increase, Growth |
“The population saw a steady rise from 1700 to 2000.” |
|
Surpassing |
Verb |
Exceeding in amount or number |
Overcoming, Outpacing |
“The population surpassed 50 million by 2000.” |
|
Significantly |
Adverb |
To a great or important degree |
Considerably, Markedly |
“The population grew significantly over the 300 years.” |
|
Observed |
Verb |
Noticed or witnessed, typically over a period of time |
Seen, Recorded |
“A period of stability was observed between 1750 and 1800.” |
|
Rebounded |
Verb |
To recover or bounce back after a decline or setback |
Recover, Resurge |
“The birth rate rebounded after 1950.” |
|
At |
Preposition |
Used to indicate a specific time or position |
During, In |
“The population reached 50 million at the end of the period.” |
|
From |
Preposition |
Used to indicate the starting point of a range or period |
Starting, Beginning |
“The data spans from 1700 to 2000.” |


Our Books

Master IELTS Speaking Part 1
IELTS Writing Task 1 Book
IELTS Writing Task 2 Book
Writing Task 1 Question Types
Practice IELTS Other Modules
IELTS Listening
The IELTS Listening test assesses how well you can understand spoken English in various contexts. It lasts about 30 minutes and is divided into four sections with a total of 40 questions. The listening tasks become increasingly difficult as the test progresses.
IELTS Academic Reading
The IELTS Academic Reading section assesses your ability to understand and interpret a variety of texts in academic settings. It is designed to evaluate a range of reading skills, including skimming for gist, reading for main ideas, reading for detail, understanding inferences, and recognizing a writer's opinions and arguments.
IELTS Speaking
The IELTS Speaking test assesses your ability to communicate in English on everyday topics. It lasts 11-14 minutes and consists of three parts: introduction, cue card, and a discussion based on the cue card topic.
IELTS General Reading
IELTS General Reading tests your ability to understand and interpret various types of texts. Here are some key areas and types of content you can expect to encounter in the reading section, along with tips for effective preparation.
IELTS Academic Writing Task 1
In IELTS Academic Writing Task 1, you are presented with a visual representation of information, such as graphs, charts, tables, or diagrams, and you are required to summarize, compare, or explain the data in your own words.
IELTS General Writing Task 1
In IELTS General Writing Task 1, you are required to write a letter based on a given situation. The letter can be formal, semi-formal, or informal, depending on the prompt. Here’s a breakdown of the key components to include in your letter
IELTS Academic Writing Task 2
In IELTS Academic Writing Task 2, you are required to write an essay in response to a question or topic. Here’s a guide to help you understand the essential elements of this task
IELTS Exam Tips
To succeed in the IELTS exam, practice regularly, familiarize yourself with the test format, improve your vocabulary, develop time management skills, and take mock tests to build confidence.
Grammer for IELTS
Grammar is the foundation of effective communication in English. Understanding tense usage, subject-verb agreement, and sentence structure enhances clarity and coherence in writing and speaking.
Vocabulary for IELTS
Vocabulary plays a crucial role in the IELTS (International English Language Testing System) exam, especially in the Speaking and Writing sections. Here’s an overview of why vocabulary is important and how it impacts your performance
RECENT IELTS SAMPLES QUESTIONS AND ANSWERS

Task 1 – Diagram – Comparison of Stone Tool Development Over Time
20:00 Start Pause Stop [df_adh_heading title_infix="IELTS Writing Task 1 Question" use_divider="on"...

Task 1 – Flow chart -Life Cycle of a Frog
20:00 Start Pause Stop [df_adh_heading title_infix="IELTS Writing Task 1 Question" use_divider="on"...

Task 1 – Flow chart -The process that is used to manufacture bricks for the building industry.
20:00 Start Pause Stop [df_adh_heading title_infix="IELTS Writing Task 1 Question" use_divider="on"...

Task 1 – Map – Changes that took place in Youngsville in New Zealand over a 25 year period from 1980 to 2005.
20:00 Start Pause Stop [df_adh_heading title_infix="IELTS Writing Task 1 Question" use_divider="on"...

Task 1 – Pie Chart – The average household expenditures in Japan and Malaysia in the year 2010
20:00 Start Pause Stop [df_adh_heading title_infix="IELTS Writing Task 1 Question" use_divider="on"...
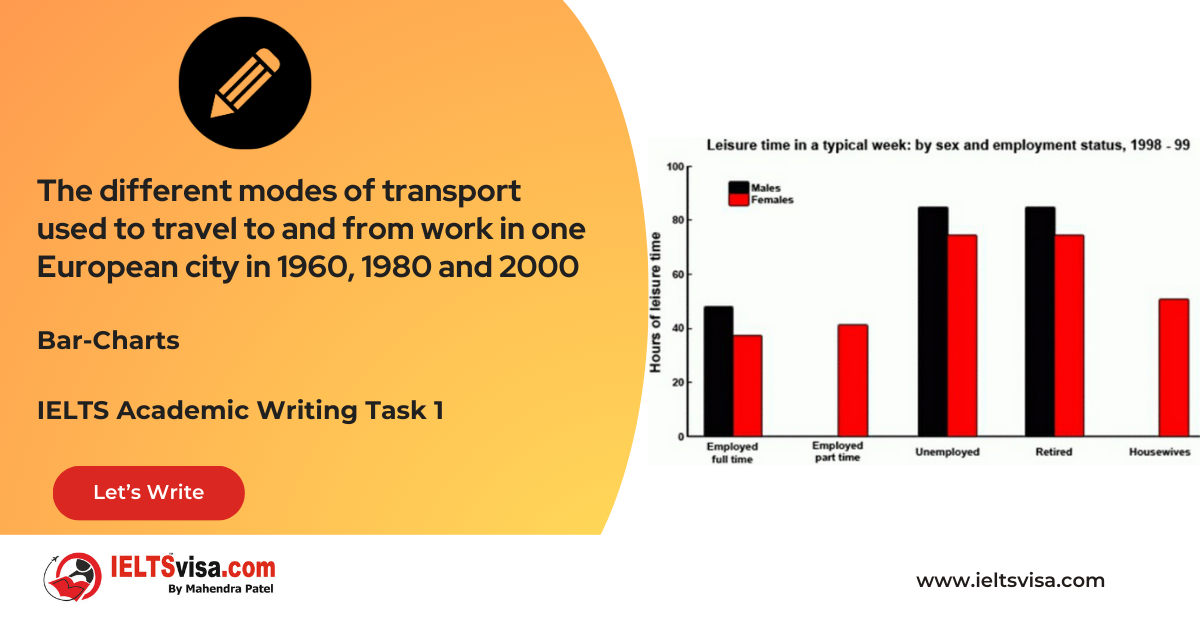
Task 1 – Bar Graph – The different modes of transport used to travel to and from work in one European city in 1960, 1980 and 2000
20:00 Start Pause Stop [df_adh_heading title_infix="IELTS Writing Task 1 Question" use_divider="on"...
Our IT Company Services


