The different modes of transport used to travel to and from work in one European city in 1960, 1980 and 2000
IELTS Academic Writing Task 1 - Bar Graph
IELTS Writing Task 1 Question
The different modes of transport used to travel to and from work in one European city in 1960, 1980 and 2000

Common Questions for the Bar Graph
1. Diagram Type: Bar chart
2. Title: Modes of Transport Used to Commute to Work (1960, 1980, 2000)
3. What are the units of measurement? Percentage of total travellers
4. Who: University lecturers, transport researchers, urban planners
5. When: 1960, 1980, 2000
6. Where: A European city (unspecified)
7. Topic: Changes in the modes of transport used for commuting over time
Detailed Process and Observations
Summary of Data : The bar chart compares the amount of leisure time men and women had weekly across five categories of employment status between 1998 and 1999. Overall, men had more leisure time than women in three categories, while women were shown in two categories: housewives and part-time employed.
- Full-time Employment:
- Men had slightly more leisure time than women. Men enjoyed about 45 hours of leisure per week, while women had approximately 38 hours.
- Unemployed and Retired People:
- Both retired and unemployed individuals had the most free time. Retired males and females had the same amount of leisure time as the unemployed: around 85 hours per week for males and 78 hours per week for females.
- Part-time Employment and Housewives:
- Housewives had 50 hours of leisure time, which was slightly more than the 40+ hours that part-time working women had each week. No data was provided for men in these categories.
Sample Answer
The bar chart illustrates how commuters in a European city travelled to and from work in 1960, 1980, and 2000.
Overall, car use became the dominant mode of transport by 2000, while walking, cycling, and bus usage saw a notable decline.
In 1960, walking was the most common mode of transport, with 35% of people commuting on foot. Only 5% of commuters used cars, while 25% travelled by bike and 18% by bus. By 1980, the trend had started to shift, with buses becoming the most popular choice at 25%, surpassing walking, which had dropped to 17%. Car use rose to 22%, and bike usage was at 20%.
By 2000, the trend had changed even more drastically. Car usage surged to 35%, while bus travel fell to 16%. Walking and cycling had both decreased further, with only 9% and 6% of commuters using these modes, respectively.
Top 29 Vocabulary
| Vocabulary | Meaning | Synonyms | Examples | Type |
|---|---|---|---|---|
| Proportion | A part or share of the whole | Percentage, share | The proportion of people who walked to work fell significantly by 2000. | Noun |
| Mode of transport | A way or method of travelling from one place to another | Means of transport, vehicle | Cars became the most popular mode of transport by 2000. |
Noun (Phrase) |
| Commuters | People who travel regularly to and from work | Travelers, workers | Commuters in 1960 mainly walked or cycled to work. | Noun (Plural) |
| Steadily | Gradually or consistently over time | Consistently, continually | The percentage of car commuters rose steadily over the years. | Adverb |
| Decline | A decrease or reduction | Drop, decrease, fall | The number of people travelling by bus saw a significant decline by 2000. | Noun / Verb |
|
Illustrates |
To explain or clarify with examples or pictures |
Depicts, shows |
“The bar chart illustrates the changing commuting patterns over time.” |
Verb |
|
Dominant |
Most important or influential |
Leading, prevailing |
“Car use became the dominant mode of transport by 2000.” |
Adjective |
|
Notable |
Worthy of attention or importance |
Significant, remarkable |
“Walking, cycling, and bus usage saw a notable decline.” |
Adjective |
|
Shift |
A change or movement from one state to another |
Change, transition |
“By 1980, the trend had started to shift towards bus usage.” |
Noun/Verb |
|
Trend |
A general direction in which something is developing |
Pattern, tendency |
“The trend in car usage became more prominent by 2000.” |
Noun |
|
Surge |
A large or sudden increase |
Spike, rise |
“Car usage surged to 35% by 2000.” |
Noun/Verb |
|
Drastically |
In a way that is extreme or severe |
Radically, significantly |
“By 2000, car use increased drastically, surpassing other modes.” |
Adverb |
|
Drop |
A decrease in amount or level |
Decline, reduction |
“There was a noticeable drop in bus usage by 2000.” |
Noun/Verb |
|
Subsequently |
Following in time or order |
Afterwards, later |
“Subsequently, car usage became the most common transport mode.” |
Adverb |
|
Percentage |
A proportion expressed as a fraction of 100 |
Fraction, rate |
“The percentage of commuters walking to work decreased over time.” |
Noun |
|
Fell |
To decrease or drop |
Decreased, dropped |
“The number of people walking to work fell significantly.” |
Verb |
|
Common |
Usual or frequently occurring |
Frequent, typical |
“Walking was the most common mode of transport in 1960.” |
Adjective |
|
Usage |
The action of using something |
Consumption, utilization |
“The usage of buses decreased significantly by 2000.” |
Noun |
|
Compare |
To examine the similarities and differences |
Contrast, assess |
“We can compare the changes in commuting modes over the three decades.” |
Verb |
|
Period |
A specific length of time |
Duration, interval |
“The bar chart compares commuting modes over a period from 1960 to 2000.” |
Noun |
|
Peaked |
Reached the highest point |
Reached, culminated |
“Cycling usage peaked at 25% in 1960.” |
Verb |
|
Reflect |
To show, express, or represent |
Represent, indicate |
“The bar chart reflects changes in commuting patterns.” |
Verb |
|
Prior |
Previous or earlier in time |
Former, earlier |
“Prior to 1980, walking was the most common method of commuting.” |
Adjective |
|
Amount |
A quantity or total of something |
Quantity, sum |
“The amount of people using cars rose steadily each year.” |
Noun |
|
Reveals |
To make something known or visible |
Shows, discloses |
“The graph reveals a decline in walking and cycling usage.” |
Verb |
|
Statistical |
Pertaining to data or numerical analysis |
Data-driven, numerical |
“The statistical data highlights the increase in car usage.” |
Adjective |
|
Category |
A classification or grouping of things |
Group, type |
“The chart shows commuters grouped by mode of transport.” |
Noun |
|
Contribution |
The act of giving or adding to something |
Addition, input |
“Each mode of transport made a unique contribution to the total.” |
Noun |
|
Proportionally |
In relation to something else, in terms of proportion |
Relatively, comparably |
“Bus usage decreased proportionally to car usage.” |
Adverb |


Our Books

Master IELTS Speaking Part 1
IELTS Writing Task 1 Book
IELTS Writing Task 2 Book
Writing Task 1 Question Types
Practice IELTS Other Modules
IELTS Listening
The IELTS Listening test assesses how well you can understand spoken English in various contexts. It lasts about 30 minutes and is divided into four sections with a total of 40 questions. The listening tasks become increasingly difficult as the test progresses.
IELTS Academic Reading
The IELTS Academic Reading section assesses your ability to understand and interpret a variety of texts in academic settings. It is designed to evaluate a range of reading skills, including skimming for gist, reading for main ideas, reading for detail, understanding inferences, and recognizing a writer's opinions and arguments.
IELTS Speaking
The IELTS Speaking test assesses your ability to communicate in English on everyday topics. It lasts 11-14 minutes and consists of three parts: introduction, cue card, and a discussion based on the cue card topic.
IELTS General Reading
IELTS General Reading tests your ability to understand and interpret various types of texts. Here are some key areas and types of content you can expect to encounter in the reading section, along with tips for effective preparation.
IELTS Academic Writing Task 1
In IELTS Academic Writing Task 1, you are presented with a visual representation of information, such as graphs, charts, tables, or diagrams, and you are required to summarize, compare, or explain the data in your own words.
IELTS General Writing Task 1
In IELTS General Writing Task 1, you are required to write a letter based on a given situation. The letter can be formal, semi-formal, or informal, depending on the prompt. Here’s a breakdown of the key components to include in your letter
IELTS Academic Writing Task 2
In IELTS Academic Writing Task 2, you are required to write an essay in response to a question or topic. Here’s a guide to help you understand the essential elements of this task
IELTS Exam Tips
To succeed in the IELTS exam, practice regularly, familiarize yourself with the test format, improve your vocabulary, develop time management skills, and take mock tests to build confidence.
Grammer for IELTS
Grammar is the foundation of effective communication in English. Understanding tense usage, subject-verb agreement, and sentence structure enhances clarity and coherence in writing and speaking.
Vocabulary for IELTS
Vocabulary plays a crucial role in the IELTS (International English Language Testing System) exam, especially in the Speaking and Writing sections. Here’s an overview of why vocabulary is important and how it impacts your performance
RECENT IELTS SAMPLES QUESTIONS AND ANSWERS

Task 1 – Column graph – Percentage of Young People Enrolled in Universities in 2000 and 2007.
20:00 Start Pause Stop [df_adh_heading title_infix="IELTS Writing Task 1 Question" use_divider="on"...
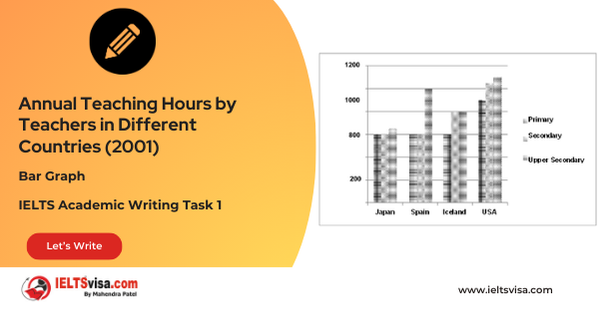
Task 1 – Bar Graph – Annual Teaching Hours by Teachers in Different Countries (2001)
20:00 Start Pause Stop [df_adh_heading title_infix="IELTS Writing Task 1 Question" use_divider="on"...
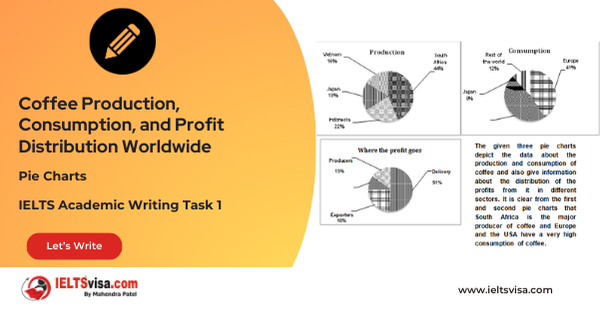
Task 1 – Pie Charts – Coffee Production, Consumption, and Profit Distribution Worldwide
20:00 Start Pause Stop [df_adh_heading title_infix="IELTS Writing Task 1 Question" use_divider="on"...

Task 1 – Column graph – Types of Transport Used by Tourists Visiting New Zealand from Five Countries in 2004.
20:00 Start Pause Stop [df_adh_heading title_infix="IELTS Writing Task 1 Question" use_divider="on"...
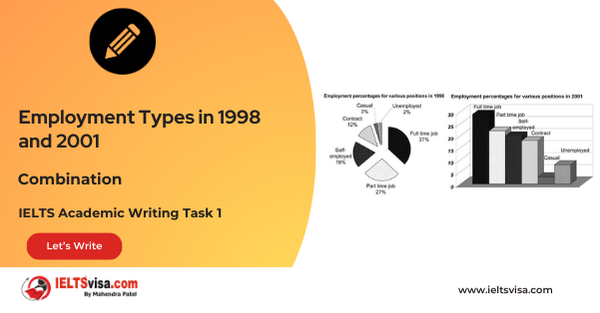
Task 1 – Bar and Pie Chart Combination – Employment Types in 1998 and 2001
20:00 Start Pause Stop [df_adh_heading title_infix="IELTS Writing Task 1 Question" use_divider="on"...
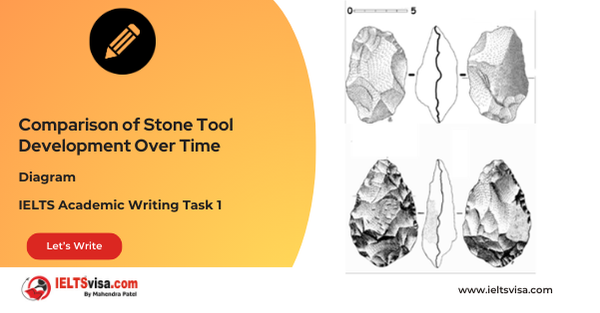
Task 1 – Diagram – Comparison of Stone Tool Development Over Time
20:00 Start Pause Stop [df_adh_heading title_infix="IELTS Writing Task 1 Question" use_divider="on"...
Our IT Company Services


