The average children born per woman in 5 countries in 1970 and 2000
IELTS Academic Writing Task 1 - Bar Graph
IELTS Writing Task 1 Question
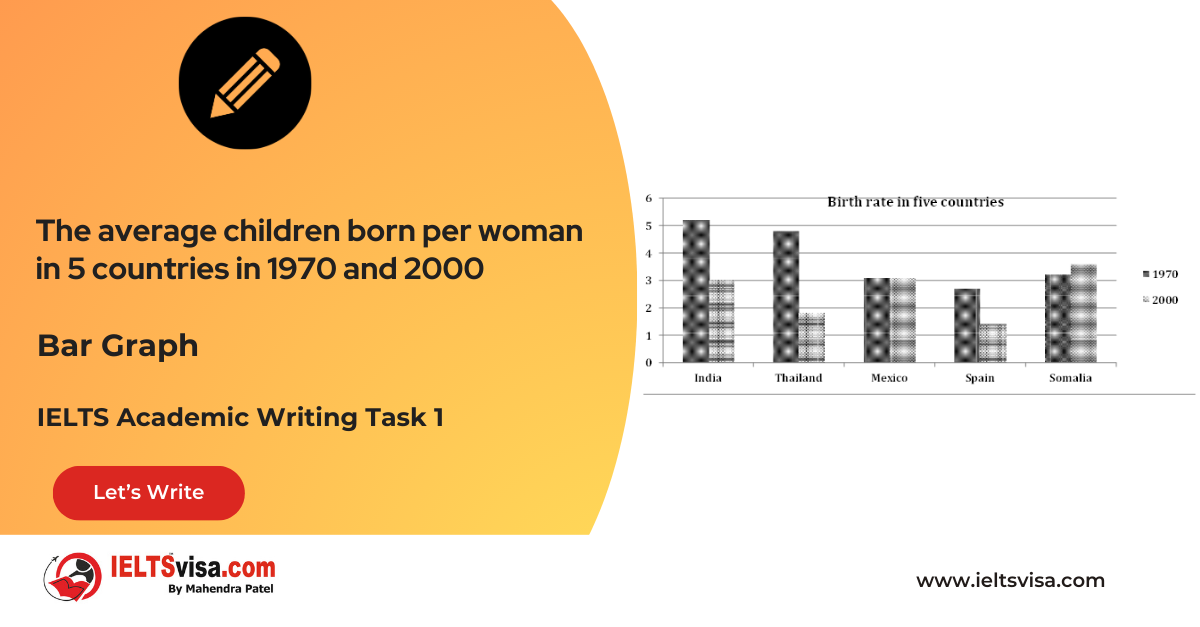
The bar chart below shows about the average children born per woman in 5 countries in 1970 and 2000. Summarise the information by selecting and reporting the main features and make comparisons where relevant

Common Questions for the Bar Graph
1. Graph Type: Bar Chart
2. Title: Average Children Born Per Woman in Five Countries (1970 and 2000)
3. What are the units of measurement?: Average number of children born per woman
4. Who: Women in India, Thailand, Mexico, Spain, and Somalia
5. When: 1970 and 2000
6. Where: Five countries (India, Thailand, Mexico, Spain, Somalia)
7. Topic: Trends in birth rates per woman
Comparison Showing and Trends
Comparison 1: 1970 Birth Rates
- Details:
- India had the highest birth rate (5.2), followed by Thailand (4.8).
2.Mexico, Spain, and Somalia had similar birth rates, ranging from 2.8 to 3.1.
Comparison 2 : 2000 Birth Rates
- Details:
- Somalia showed the highest birth rate in 2000 (3.6).
2. India and Mexico both had around 3 births per woman.
3. Spain and Thailand reported significant decreases, with birth rates between 1 and 2.
Comparison 3 : Trends Over Time
- Details:
- Somalia was the only country to show an increase in birth rates over the period.
2.India, Thailand, and Spain experienced significant decreases.
3. Mexico maintained a stable birth rate over the decades.
Sample Answer
The bar chart compares the average number of children born per woman in five countries—India, Thailand, Mexico, Spain, and Somalia—in 1970 and 2000.
Overall, birth rates declined in most countries, particularly in India, Spain, and Thailand, while Somalia saw an upward trend. Mexico remained consistent over the three decades, with no notable changes.
In 1970, India recorded the highest birth rate, with 5.2 children per woman, closely followed by Thailand at 4.8. Somalia, Mexico, and Spain had similar birth rates, ranging between 2.8 and 3.1. By 2000, Somalia surpassed all other countries, with an increased birth rate of approximately 3.6 children per woman.
In contrast, India and Mexico both reported around 3 births per woman in 2000, representing a significant decline for India but no change for Mexico. Spain and Thailand had the lowest birth rates in 2000, each falling between 1 and 2 children per woman, reflecting substantial decreases compared to their 1970 levels.
Top 30 Vocabularies
| Vocabulary (type) | Type | Meaning | Synonyms | Examples |
| Birth Rate | Noun | The average number of births per woman | Fertility rate | India had the highest birth rate in 1970. |
| Decline | Verb /Noun | A gradual decrease | Drop, Reduction | A decline in birth rates was observed in Spain and Thailand. |
| Significant | Adjective | Noticeable or important | Substantial, Major | There was a significant downward trend in India’s birth rate. |
| Consistent | Adjective | Unchanging over time | Stable, Steady | Mexico showed consistent birth rates over three decades. |
| Upward Trend | Noun | An increase over time | Rise, Growth | Somalia exhibited an upward trend in birth rates. |
| Compare | Verb | To examine the similarities and differences between things | Contrast, Analyze | “The chart compares birth rates in 1970 and 2000.” |
| Recorded | Verb | To have noted or documented | Registered, Logged, Listed | “India recorded the highest birth rate in 1970.” |
| Surpass | Verb | To exceed or go beyond | Outdo, Exceed, Overtake | “Somalia surpassed all other countries in 2000.” |
| Notable | Adjective | Worth noticing, important | Significant, Remarkable | “There were no notable changes in Mexico’s birth rate.” |
| Reflect | Verb | To show or indicate | Demonstrate, Indicate | “The changes reflect broader trends in fertility.” |
| Trend | Noun | A general direction or movement | Pattern, Development | “Somalia showed an upward trend in birth rates.” |
| Decrease | Verb | To reduce in size or amount | Diminish, Lessen, Drop | “Birth rates decreased significantly in India.” |
| Increase | Verb | To become larger or greater | Rise, Grow, Surge | “Somalia’s birth rate increased by 2000.” |
| Substantial | Adjective | Considerable in amount or importance | Significant, Considerable | “Spain experienced a substantial decrease in birth rates.” |
| Fertility Rate | Noun | The average number of children born to a woman | Reproduction rate | “The fertility rate declined in most countries.” |
| Reported | Verb | To state or declare | Stated, Declared, Announced | “India reported a decline in birth rates by 2000.” |
| Close | Adjective | Near or almost the same | Similar, Approaching | “Thailand’s birth rate was closely followed by India.” |
| Rise | Noun | An increase or growth | Increase, Upsurge | “There was a rise in Somalia’s birth rate in 2000.” |
| Steady | Adjective | Regular, not changing or fluctuating | Consistent, Stable | “Mexico maintained a steady birth rate over the decades.” |
| Gradual | Adjective | Happening slowly over time | Slow, Progressive | “India’s decline in birth rates was gradual.” |
| Fluctuate | Verb | To change or vary frequently | Vary, Shift, Waver | “Some countries showed fluctuating birth rates.” |
| Hovering | Verb | To remain around a particular level | Lingering, Floating | “Mexico’s rate hovered between 2.8 and 3.1 children per woman.” |
| Gap | Noun | A noticeable difference or space | Disparity, Difference | “There was a gap in birth rates between India and Thailand.” |
| Relatively | Adverb | In comparison to other things | Comparatively, By contrast | “The birth rate in Spain was relatively low.” |
| Subtle | Adjective | Not obvious or easily noticeable | Fine, Slight | “The change in Spain’s birth rate was subtle.” |
| Demographic | Noun | Related to the structure of populations | Population, Population statistics | “The chart shows demographic changes over 30 years.” |
| Trendline | Noun | A line that represents the general direction of data | Line of best fit, Pattern line | “The trendline shows a consistent decline for most countries.” |
| Forecasted | Verb | Predicted or estimated for the future | Projected, Predicted | “The birth rate is forecasted to continue declining.” |
| Increase | Noun | A growth or rise in numbers or amounts | Surge, Growth | “Somalia’s increase in birth rate stood out.” |
| Dramatic | Adjective | Sudden and extreme | Striking, Extreme | “India’s dramatic decline in birth rate was evident.” |


Our Books

Master IELTS Speaking Part 1
IELTS Writing Task 1 Book
IELTS Writing Task 2 Book
Writing Task 1 Question Types
Practice IELTS Other Modules
IELTS Listening
The IELTS Listening test assesses how well you can understand spoken English in various contexts. It lasts about 30 minutes and is divided into four sections with a total of 40 questions. The listening tasks become increasingly difficult as the test progresses.
IELTS Academic Reading
The IELTS Academic Reading section assesses your ability to understand and interpret a variety of texts in academic settings. It is designed to evaluate a range of reading skills, including skimming for gist, reading for main ideas, reading for detail, understanding inferences, and recognizing a writer's opinions and arguments.
IELTS Speaking
The IELTS Speaking test assesses your ability to communicate in English on everyday topics. It lasts 11-14 minutes and consists of three parts: introduction, cue card, and a discussion based on the cue card topic.
IELTS General Reading
IELTS General Reading tests your ability to understand and interpret various types of texts. Here are some key areas and types of content you can expect to encounter in the reading section, along with tips for effective preparation.
IELTS Academic Writing Task 1
In IELTS Academic Writing Task 1, you are presented with a visual representation of information, such as graphs, charts, tables, or diagrams, and you are required to summarize, compare, or explain the data in your own words.
IELTS General Writing Task 1
In IELTS General Writing Task 1, you are required to write a letter based on a given situation. The letter can be formal, semi-formal, or informal, depending on the prompt. Here’s a breakdown of the key components to include in your letter
IELTS Academic Writing Task 2
In IELTS Academic Writing Task 2, you are required to write an essay in response to a question or topic. Here’s a guide to help you understand the essential elements of this task
IELTS Exam Tips
To succeed in the IELTS exam, practice regularly, familiarize yourself with the test format, improve your vocabulary, develop time management skills, and take mock tests to build confidence.
Grammer for IELTS
Grammar is the foundation of effective communication in English. Understanding tense usage, subject-verb agreement, and sentence structure enhances clarity and coherence in writing and speaking.
Vocabulary for IELTS
Vocabulary plays a crucial role in the IELTS (International English Language Testing System) exam, especially in the Speaking and Writing sections. Here’s an overview of why vocabulary is important and how it impacts your performance
RECENT IELTS SAMPLES QUESTIONS AND ANSWERS

Task 1 – Map -Changes in Pentland Coastal Area from 1950 to 2007
[df_adh_heading title_infix="IELTS Writing Task 1 Question" use_divider="on"...

Task 1 – Map -Changes in a Park from 1980 to Present
[df_adh_heading title_infix="IELTS Writing Task 1 Question" use_divider="on"...

Task 1 – Maps – The changes made in an Australian park
20:00 Start Pause Stop [df_adh_heading title_infix="IELTS Writing Task 1 Question" use_divider="on"...

Task 1 – Maps- The map shows the village park, now and 10 years ago
20:00 Start Pause Stop [df_adh_heading title_infix="IELTS Writing Task 1 Question" use_divider="on"...

Task 1 – Map -Changes in Sydney International Airport from 1930 to Present
[df_adh_heading title_infix="IELTS Writing Task 1 Question" use_divider="on"...
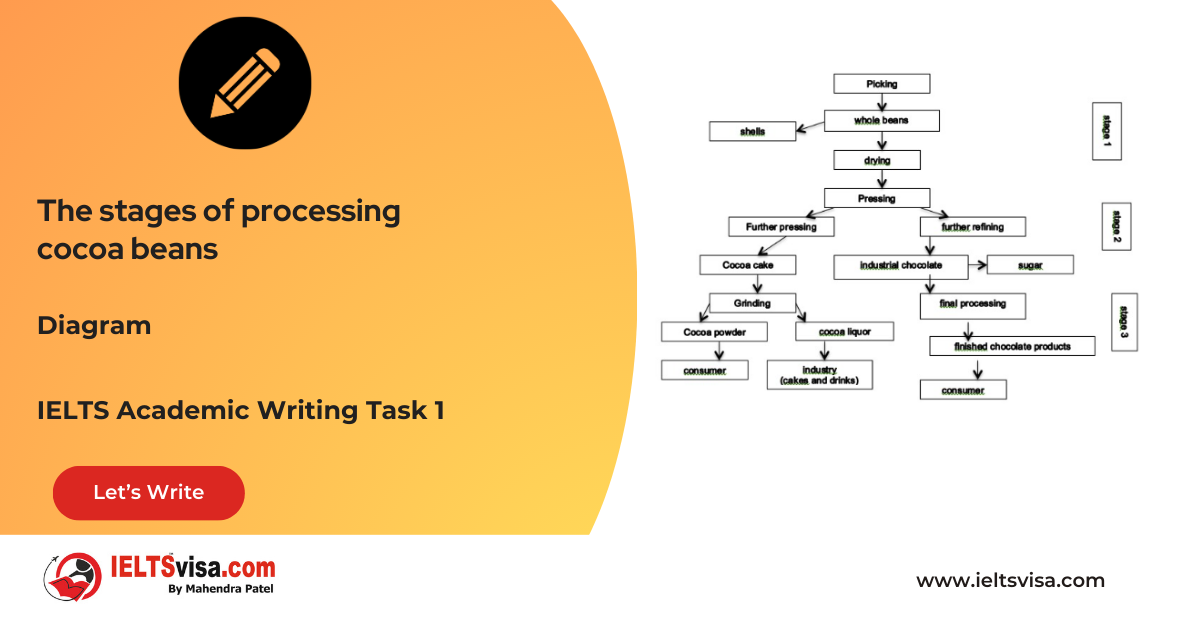
Task 1 – Diagram – The stages of processing cocoa beans
20:00 Start Pause Stop [df_adh_heading title_infix="IELTS Writing Task 1 Question" use_divider="on"...
Our IT Company Services


