The average calorie intake per person in eight countries in 2003
IELTS Academic Writing Task 1 - Bar Graph
IELTS Writing Task 1 Question
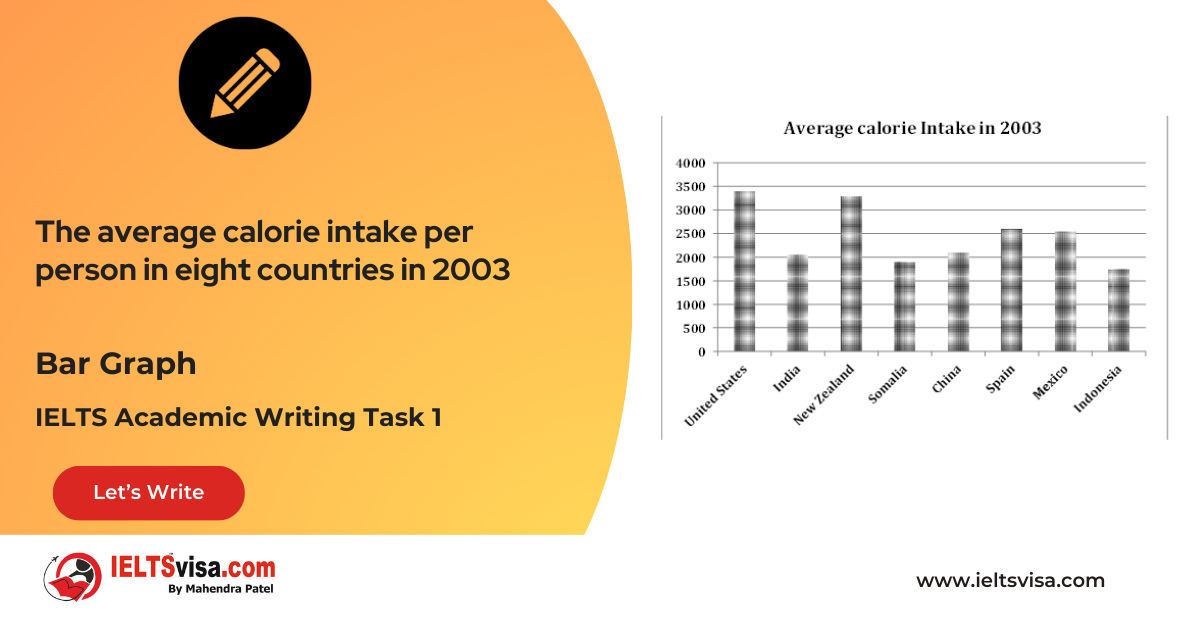
The graph below shows the average calorie intake per person in eight countries in 2003. Summarise the information by selecting and reporting the main features and make comparisons where relevant.

Common Questions for the Bar Graph
1. Graph Type: Bar Graph
2. Title: Average Calorie Intake Per Person in Eight Countries in 2003
3. What are the units of measurement?: Average daily calorie intake (calories)
4. Who: People in eight different countries
5. When: 2003
6. Where: Eight countries (USA, New Zealand, Spain, Mexico, China, India, Somalia, Indonesia)
7. Topic: Average calorie consumption per person in various countries in 2003
Comparison Showing and Trends
Comparison 1: Highest and lowest caloric intake in 2003
- Details:
- The United States had the highest calorie consumption, at 3350 calories per day.
2. Indonesia had the lowest, with an average of 1800 calories per day.
Comparison 2: Mid-level calorie consumption
- Details:
- New Zealand followed the USA, averaging 3200 calories per day.
2. Spain and Mexico consumed slightly over 2500 calories per day.
Other Observations :
- Details:
- China averaged 2200 calories daily, while India consumed 2100.
2. Somalia and Indonesia had the same low intake of around 1800 calories per day.
Sample Answer
The bar graph illustrates the average daily calorie intake per person in eight countries in 2003.
Overall, calorie consumption in the eight countries ranged widely, with the highest intake in the USA being nearly double that of countries like Indonesia and Somalia. The graph indicates notable variations in average caloric intake, reflecting differences in lifestyle, food availability, and possibly economic development among the countries.
In detail, the United States led the chart with an average of 3350 calories consumed daily, closely followed by New Zealand at 3200 calories. Spain and Mexico showed moderate consumption levels, with slightly more than 2500 calories per person per day. These figures placed them in the mid-range of the eight countries.
On the lower end, China and India had daily averages of 2200 and 2100 calories, respectively. Indonesia and Somalia reported the least caloric intakes, averaging around 1800 calories daily. This significant disparity highlights the differences in dietary habits and availability of resources across these nations.
Top 29 Vocabularies
| Vocabulary (type) | Type | Meaning | Synonyms | Examples |
| Staggering | Adjective | Extremely surprising or shocking | Astonishing, Startling | The staggering calorie difference caught my attention. |
| Intake | Noun | Amount of food or drink consumed | Consumption, Ingestion | Daily calorie intake varies across nations. |
| Spectrum | Noun | A range or scope | Span, Array | The data covers a broad spectrum of dietary habits. |
| Moderate |
Adjective
|
Average in size or amount | Middling, Reasonable | Spain and Mexico showed moderate calorie intake. |
| Disparity | Noun | A great difference | Gap, Inequality | The disparity in calorie intake reflects inequality. |
| Illustrates | Verb | To explain or make something clear using visuals | Depicts, demonstrates, shows | “The bar graph illustrates calorie intake across countries.” |
| Calorie | Noun | A unit of energy from food | Energy unit, kilocalorie | “Daily calorie intake varied widely between nations.” |
| Consumption | Noun | The act of consuming food or drink | Intake, use, ingestion | “Calorie consumption was highest in the USA.” |
| Variations | Noun | Differences or changes in amount or level | Differences, fluctuations, disparities | “There are notable variations in caloric intake.” |
| Availability | Noun | The state of being able to be used or obtained | Accessibility, presence, readiness | “Food availability influences calorie consumption.” |
| Economic | Adjective | Related to finances or resources | Financial, monetary | “Economic development affects dietary habits.” |
| Development | Noun | Growth or progress in a specific area | Advancement, progress, growth | “Differences in development lead to dietary disparities.” |
| Average | Noun/Adjective | A typical or mean amount or value | Mean, median, standard | “The average intake in India was 2100 calories daily.” |
| Closely | Adverb | With little distance or difference | Near, approximately, tightly | “New Zealand closely followed the USA in calorie consumption.” |
| Moderate | Adjective | Not excessive or extreme | Reasonable, average, balanced | “Mexico had a moderate level of calorie intake.” |
| Resources | Noun | Assets or materials used to achieve a goal | Supplies, tools, provisions | “Countries with limited resources had lower intakes.” |
| Significant | Adjective | Sufficiently large to be noticed | Notable, considerable, meaningful | “The significant difference reflects inequality.” |
| Reflects | Verb | Shows or represents something | Indicates, demonstrates, portrays | “The data reflects disparities in lifestyle and diet.” |
| Lifestyle | Noun | The way in which a person or group lives | Way of life, habits, routine | “Calorie intake can reflect the lifestyle of a population.” |
| Habit | Noun | A regular practice or behavior | Routine, custom, tendency | “Dietary habits vary among countries.” |
| Dietary | Adjective | Relating to diet or food | Nutritional, nutritional habits | “Dietary differences were evident in the data.” |
| Nation | Noun | A country or its people | Country, state, land | “Each nation showed unique patterns in calorie consumption.” |
| Chart | Noun | A visual representation of data | Graph, table, diagram | “The chart presents average calorie intake per country.” |
| Disparity | Noun | A great difference | Inequality, imbalance, gap | “The disparity between Somalia and the USA was striking.” |
| Range | Noun | The extent or scope of something | Spectrum, span, variety | “Caloric intake ranged widely among the eight countries.” |
| Habitual | Adjective | Done as a habit | Routine, regular, customary | “Habitual consumption patterns influenced the data.” |
| Peak | Noun/Verb | The highest point | Summit, top, maximum | “Calorie intake peaked in the USA at 3350 calories daily.” |
| Decline | Noun/Verb | A decrease in amount or quality | Reduction, drop, decrease | “There was a decline in calorie intake in some countries.” |
| Highlight | Verb | To emphasize or draw attention to | Emphasize, underscore, stress | “The disparity highlights economic inequalities.” |


Our Books

Master IELTS Speaking Part 1
IELTS Writing Task 1 Book
IELTS Writing Task 2 Book
Writing Task 1 Question Types
Practice IELTS Other Modules
IELTS Listening
The IELTS Listening test assesses how well you can understand spoken English in various contexts. It lasts about 30 minutes and is divided into four sections with a total of 40 questions. The listening tasks become increasingly difficult as the test progresses.
IELTS Academic Reading
The IELTS Academic Reading section assesses your ability to understand and interpret a variety of texts in academic settings. It is designed to evaluate a range of reading skills, including skimming for gist, reading for main ideas, reading for detail, understanding inferences, and recognizing a writer's opinions and arguments.
IELTS Speaking
The IELTS Speaking test assesses your ability to communicate in English on everyday topics. It lasts 11-14 minutes and consists of three parts: introduction, cue card, and a discussion based on the cue card topic.
IELTS General Reading
IELTS General Reading tests your ability to understand and interpret various types of texts. Here are some key areas and types of content you can expect to encounter in the reading section, along with tips for effective preparation.
IELTS Academic Writing Task 1
In IELTS Academic Writing Task 1, you are presented with a visual representation of information, such as graphs, charts, tables, or diagrams, and you are required to summarize, compare, or explain the data in your own words.
IELTS General Writing Task 1
In IELTS General Writing Task 1, you are required to write a letter based on a given situation. The letter can be formal, semi-formal, or informal, depending on the prompt. Here’s a breakdown of the key components to include in your letter
IELTS Academic Writing Task 2
In IELTS Academic Writing Task 2, you are required to write an essay in response to a question or topic. Here’s a guide to help you understand the essential elements of this task
IELTS Exam Tips
To succeed in the IELTS exam, practice regularly, familiarize yourself with the test format, improve your vocabulary, develop time management skills, and take mock tests to build confidence.
Grammer for IELTS
Grammar is the foundation of effective communication in English. Understanding tense usage, subject-verb agreement, and sentence structure enhances clarity and coherence in writing and speaking.
Vocabulary for IELTS
Vocabulary plays a crucial role in the IELTS (International English Language Testing System) exam, especially in the Speaking and Writing sections. Here’s an overview of why vocabulary is important and how it impacts your performance
RECENT IELTS SAMPLES QUESTIONS AND ANSWERS

Task 1 – Column graph – Percentage of Young People Enrolled in Universities in 2000 and 2007.
20:00 Start Pause Stop [df_adh_heading title_infix="IELTS Writing Task 1 Question" use_divider="on"...
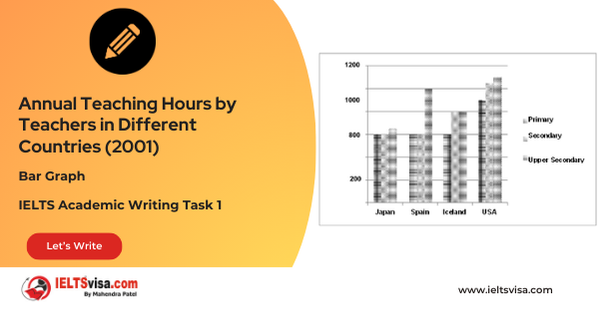
Task 1 – Bar Graph – Annual Teaching Hours by Teachers in Different Countries (2001)
20:00 Start Pause Stop [df_adh_heading title_infix="IELTS Writing Task 1 Question" use_divider="on"...
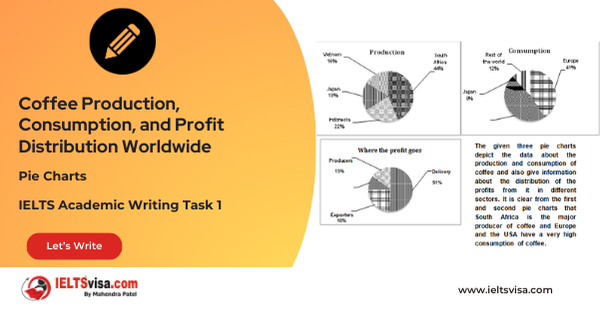
Task 1 – Pie Charts – Coffee Production, Consumption, and Profit Distribution Worldwide
20:00 Start Pause Stop [df_adh_heading title_infix="IELTS Writing Task 1 Question" use_divider="on"...

Task 1 – Column graph – Types of Transport Used by Tourists Visiting New Zealand from Five Countries in 2004.
20:00 Start Pause Stop [df_adh_heading title_infix="IELTS Writing Task 1 Question" use_divider="on"...
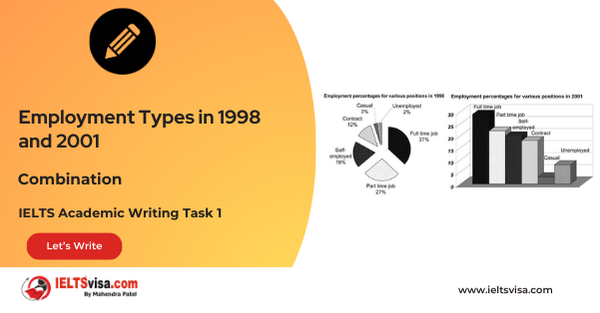
Task 1 – Bar and Pie Chart Combination – Employment Types in 1998 and 2001
20:00 Start Pause Stop [df_adh_heading title_infix="IELTS Writing Task 1 Question" use_divider="on"...
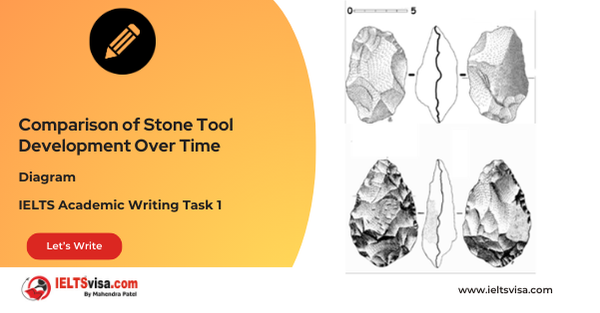
Task 1 – Diagram – Comparison of Stone Tool Development Over Time
20:00 Start Pause Stop [df_adh_heading title_infix="IELTS Writing Task 1 Question" use_divider="on"...
Our IT Company Services


