Average class size in six countries and compares it with the world average class size in 2006
IELTS Academic Writing Task 1 - Bar Graph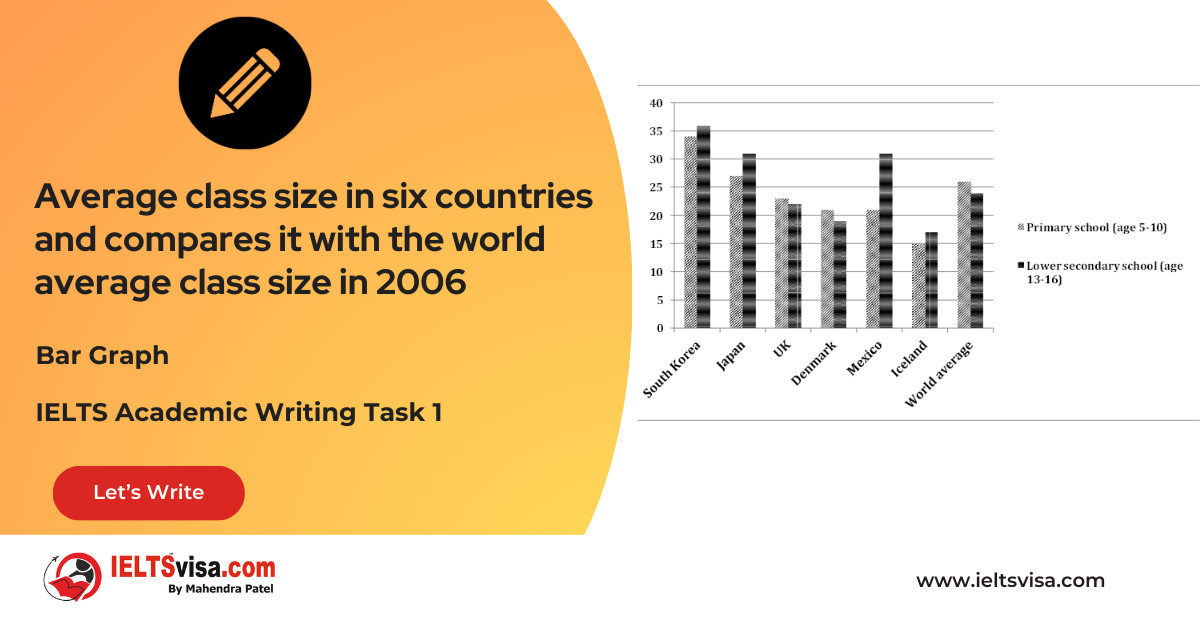
IELTS Writing Task 1 Question
The graph below shows the average class size in six countries and compares it with the world average class size in 2006. Summarise the information by selecting and reporting the main points and give comparisons where relevant.

Common Questions for the Bar Graph
1. Graph Type: Column Graph
2.Title: Average Class Size in Six Countries Compared to the World Average (2006)
3.Units of Measurement : Average number of students per class
4.Who: Primary and lower secondary school students
5. When: 2006
6. Where: Six countries and world average
7. Topic: Comparison of average class sizes in primary and lower secondary schools across different nations
Comparison Showing and Trends Any change over time (such as an increase or a decrease) is a trend.
Comparison 1 : Class Sizes in the UK and Denmark
- Details:
1. In both the UK and Denmark, the average class size in primary schools (23 and 21 students, respectively) was larger than in lower secondary schools (22 and 19 students, respectively).
2. This trend mirrors the world averages, which showed 26 students in primary and 24 in secondary classes.
Comparison 2: Class Sizes in South Korea and Japan
-
Details:
1. South Korea exhibited the highest average class size in both primary and secondary education, with nearly 35 students in each
2. Japan’s primary class had an average of 26 students, while the secondary class size was slightly larger at 31 students.
Comparison 3 :Class Sizes in Mexico and Iceland
Details:
1. Mexico had the largest discrepancy between primary and secondary class sizes, with about 20 students in primary compared to over 30 in secondary.
2. In contrast, Iceland had the smallest class sizes, averaging 15 students in primary and 17 in secondary.
Sample Answer
The column graph illustrates the average class sizes in primary and lower secondary schools across six countries in 2006, comparing them to the global averages.
Overall, the UK and Denmark had larger primary class sizes than their secondary counterparts, whereas other countries generally displayed smaller primary classes.
Specifically, the average class sizes in the UK and Denmark were 23 and 21 students in primary, compared to 22 and 19 in secondary. This trend aligns with the world averages of 26 in primary and 24 in secondary. South Korea stood out with the largest class sizes, averaging nearly 35 students in both primary and secondary classes. Japan’s averages were 26 in primary and slightly higher at 31 in secondary.
Interestingly, Mexico had a significant difference, with primary classes averaging about 20 students and secondary classes exceeding 30. Conversely, Iceland had the smallest class sizes of 15 in primary and 17 in secondary, indicating the best teacher-to-student ratio.
Top 29 Vocabularies
| Vocabulary | Type | Meaning | Synonyms | Examples |
|
Illustrates |
Verb |
To explain or make clear by using examples or visuals |
Depict, demonstrate, show |
“The graph illustrates average class sizes in various countries.” |
|
Discrepancy |
Noun |
A lack of compatibility or similarity between two or more facts |
Difference, inconsistency, variation |
“The largest discrepancy was seen in Mexico.” |
|
Average |
Adjective |
Typical or normal; a calculated central value |
Mean, median, standard |
“The average class size in Iceland was the smallest.” |
|
Counterpart |
Noun |
A person or thing that corresponds to or has the same function as another |
Equivalent, match, peer |
“The primary class size was larger than its secondary counterpart in the UK.” |
|
Ratio |
Noun |
A relationship between two numbers indicates how many times the first number contains the second |
Proportion, relationship, rate |
“Iceland had the best teacher-to-student ratio.” |
|
Global |
Adjective |
Relating to the entire world |
Worldwide, international |
“The global averages for class sizes were compared in the report.” |
|
Trend |
Noun |
A general direction in which something is developing |
Pattern, tendency |
“The trend indicates smaller class sizes in Iceland compared to other countries.” |
|
Align |
Verb |
To correspond or match with something |
Match, conform, agree |
“The UK class sizes align closely with the global averages.” |
|
Specifically |
Adverb |
In a detailed or exact manner |
Particularly, precisely |
“Specifically, Denmark showed smaller class sizes in secondary schools.” |
|
Stand out |
Phrasal Verb |
To be noticeably different or prominent |
Excel, distinguish |
“South Korea stood out with the largest class sizes among the countries.” |
|
Significant |
Adjective |
Having importance or being notable |
Important, noteworthy |
“Mexico showed a significant difference between primary and secondary class sizes.” |
|
Exceed |
Verb |
To go beyond a set limit |
Surpass, outdo, overtake |
“Mexico’s secondary class sizes exceeded 30 students.” |
|
Conversely |
Adverb |
Introducing an opposite or contrasting idea |
On the other hand, however |
“Conversely, Iceland had the smallest class sizes.” |
|
Indicate |
Verb |
To show, point out, or suggest |
Show, reveal, signify |
“The data indicates that South Korea had consistently large class sizes.” |
|
Averaging |
Verb |
Calculating the mean value |
Balancing, computing |
“South Korea’s class sizes averaged nearly 35 students.” |
|
Comparison |
Noun |
The act of evaluating similarities and differences |
Contrast, evaluation |
“The comparison highlights differences in class sizes globally.” |
|
Dominant |
Adjective |
Having the most influence or importance |
Leading, prevailing |
“South Korea was dominant in terms of class sizes among the six countries.” |
|
Relatively |
Adverb |
In comparison to something else |
Comparatively, somewhat |
“Relatively smaller class sizes were observed in Iceland.” |
|
Observe |
Verb |
To notice or see |
Notice, detect, perceive |
“The observed data highlights disparities in class sizes.” |
|
Proportion |
Noun |
A part or share of the whole |
Percentage, fraction |
“The proportion of secondary students was higher in Mexico than in primary.” |
|
Correspond |
Verb |
To match or be equivalent |
Relate, agree, align |
“Class sizes correspond to the teacher-to-student ratio in each country.” |
|
Fluctuate |
Verb |
To vary irregularly, especially in amount |
Change, oscillate |
“Class sizes in Japan fluctuated slightly between primary and secondary levels.” |
|
Contrast |
Noun/Verb |
A noticeable difference |
Difference, disparity |
“There is a clear contrast between Iceland and South Korea’s class sizes.” |
|
Highlight |
Verb |
To draw attention to or emphasize |
Emphasize, underline |
“The report highlights the differences in teacher-to-student ratios.” |
|
Indication |
Noun |
A sign or piece of information that suggests something |
Sign, signal, evidence |
“There is a clear indication that Iceland invests more in education per student.” |
|
Comparative |
Adjective |
Involving comparison between two or more items |
Relative, evaluative |
“The comparative analysis shows variations in class sizes across regions.” |
|
Slightly |
Adverb |
To a small degree or extent |
Marginally, a little |
“Class sizes in Japan were slightly larger at the secondary level.” |
|
Dominate |
Verb |
To have a commanding influence |
Rule, lead, prevail |
“Home Internet access dominated over other locations in the earlier study.” |
|
Ratio |
Noun |
The quantitative relation between two amounts |
Proportion, fraction |
“The ratio of students to teachers was smallest in Iceland.” |


Our Books

Master IELTS Speaking Part 1
IELTS Writing Task 1 Book
IELTS Writing Task 2 Book
Writing Task 1 Question Types
Practice IELTS Other Modules
IELTS Listening
The IELTS Listening test assesses how well you can understand spoken English in various contexts. It lasts about 30 minutes and is divided into four sections with a total of 40 questions. The listening tasks become increasingly difficult as the test progresses.
IELTS Academic Reading
The IELTS Academic Reading section assesses your ability to understand and interpret a variety of texts in academic settings. It is designed to evaluate a range of reading skills, including skimming for gist, reading for main ideas, reading for detail, understanding inferences, and recognizing a writer's opinions and arguments.
IELTS Speaking
The IELTS Speaking test assesses your ability to communicate in English on everyday topics. It lasts 11-14 minutes and consists of three parts: introduction, cue card, and a discussion based on the cue card topic.
IELTS General Reading
IELTS General Reading tests your ability to understand and interpret various types of texts. Here are some key areas and types of content you can expect to encounter in the reading section, along with tips for effective preparation.
IELTS Academic Writing Task 1
In IELTS Academic Writing Task 1, you are presented with a visual representation of information, such as graphs, charts, tables, or diagrams, and you are required to summarize, compare, or explain the data in your own words.
IELTS General Writing Task 1
In IELTS General Writing Task 1, you are required to write a letter based on a given situation. The letter can be formal, semi-formal, or informal, depending on the prompt. Here’s a breakdown of the key components to include in your letter
IELTS Academic Writing Task 2
In IELTS Academic Writing Task 2, you are required to write an essay in response to a question or topic. Here’s a guide to help you understand the essential elements of this task
IELTS Exam Tips
To succeed in the IELTS exam, practice regularly, familiarize yourself with the test format, improve your vocabulary, develop time management skills, and take mock tests to build confidence.
Grammer for IELTS
Grammar is the foundation of effective communication in English. Understanding tense usage, subject-verb agreement, and sentence structure enhances clarity and coherence in writing and speaking.
Vocabulary for IELTS
Vocabulary plays a crucial role in the IELTS (International English Language Testing System) exam, especially in the Speaking and Writing sections. Here’s an overview of why vocabulary is important and how it impacts your performance
RECENT IELTS SAMPLES QUESTIONS AND ANSWERS

Sales Percentage of Book Types from 1972 to 2012
20:00 Start Pause Stop [df_adh_heading title_infix="IELTS Writing Task 1 Question" use_divider="on"...
Comparison of Males Preferring Watching vs. Participating in Sports
20:00 Start Pause Stop [df_adh_heading title_infix="IELTS Writing Task 1 Question" use_divider="on"...
Task 1 – Line Bar– The total volume of telephone calls (in million minutes) in Denmark, divided into three categories, from 1995- 2004
20:00 Start Pause Stop [df_adh_heading title_infix="IELTS Writing Task 1 Question" use_divider="on"...
Task 1 – Table – Information about the average annual spending of university students in three different countries
20:00 Start Pause Stop [df_adh_heading title_infix="IELTS Writing Task 1 Question" use_divider="on"...
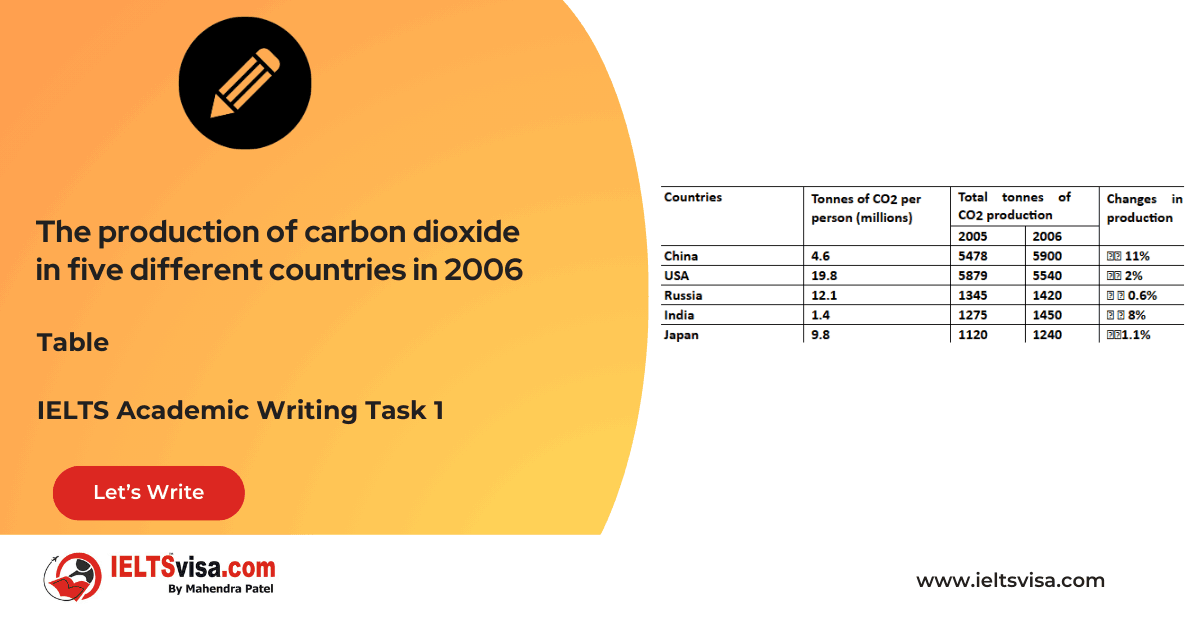
Task 1 – Table -The production of carbon dioxide in five different countries in 2006
20:00 Start Pause Stop [df_adh_heading title_infix="IELTS Writing Task 1 Question" use_divider="on"...
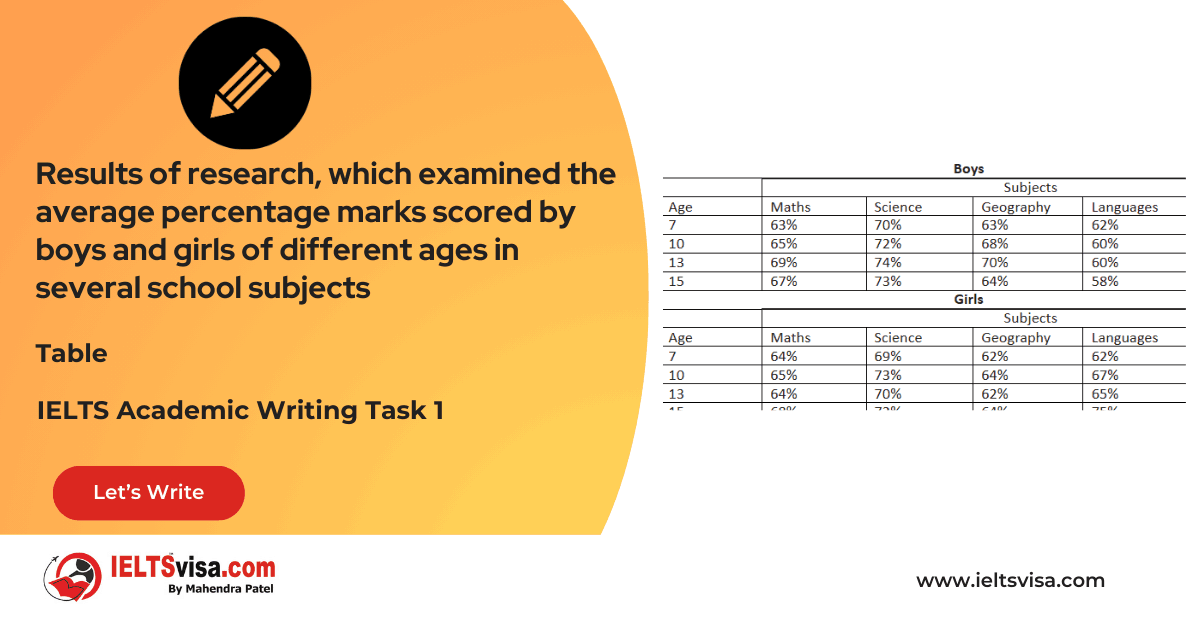
Task 1 – Table – Results of research, which examined the average percentage marks scored by boys and girls of different ages in several school subjects
20:00 Start Pause Stop [df_adh_heading title_infix="IELTS Writing Task 1 Question" use_divider="on"...
Our IT Company Services


