by iVenzu Technologies | Feb 12, 2025 | IELTS Academic Writing Task 1 Essay, Pie Charts
Workforce Distribution and Unemployment Rates in Australia (1998-2003) IELTS Academic Writing Task 1 - Pie Chart 20:00 Start Pause Stop IELTS Writing Task 1 Question The diagrams below show the categories of workforce in Australia and the unemployment within the three...
by Mahendra Patel | Feb 11, 2025 | IELTS Academic Writing Task 1 Essay, Pie Charts
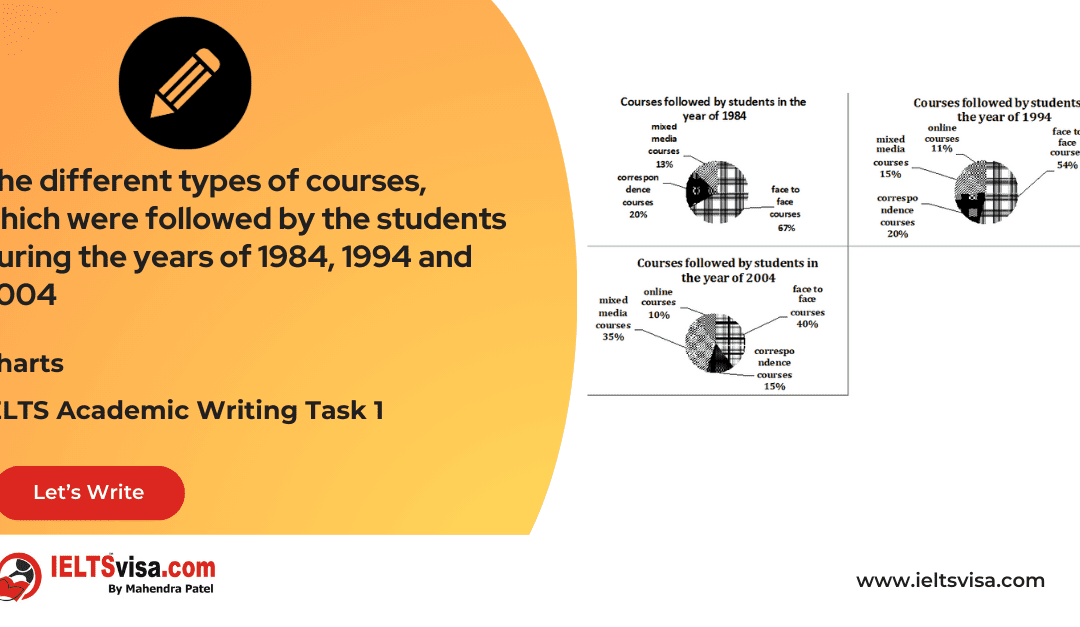
The different types of courses, which were followed by the students during the years of 1984, 1994 and 2004 IELTS Academic Writing Task 1 - Pie Chart 20:00 Start Pause Stop IELTS Writing Task 1 Question The pie charts below show the different types of...
by Mahendra Patel | Feb 11, 2025 | IELTS Academic Writing Task 1 Essay, Pie Charts
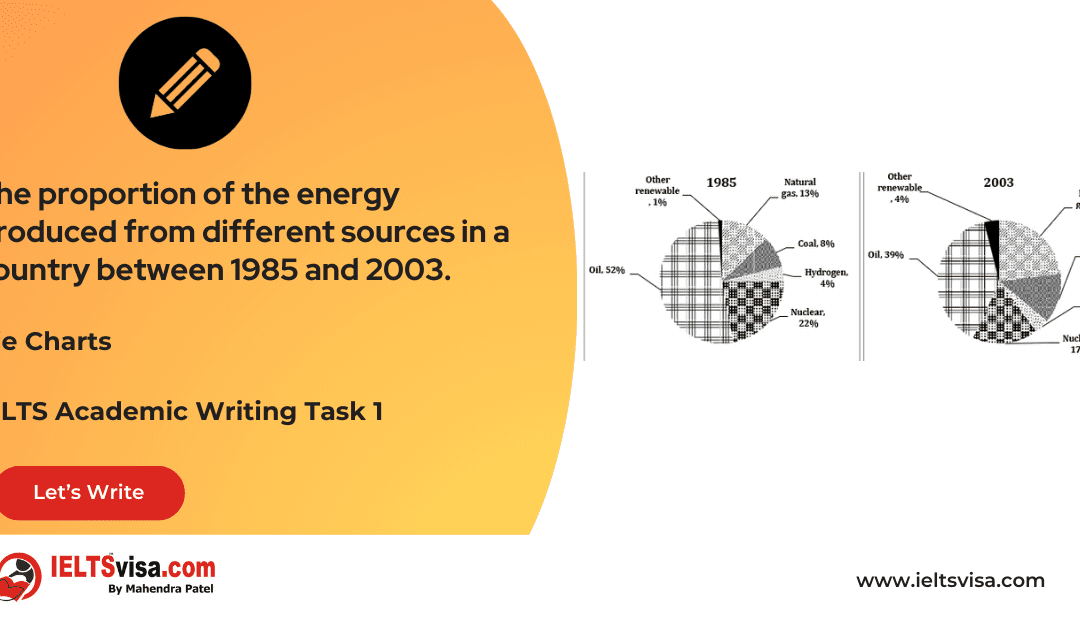
The proportion of the energy produced from different sources in a country between 1985 and 2003. IELTS Academic Writing Task 1 - Pie Chart 20:00 Start Pause Stop IELTS Writing Task 1 Question The charts below show the proportion of the energy produced...
by iVenzu Technologies | Feb 11, 2025 | Combinations, IELTS Academic Writing Task 1 Essay, Pie Charts
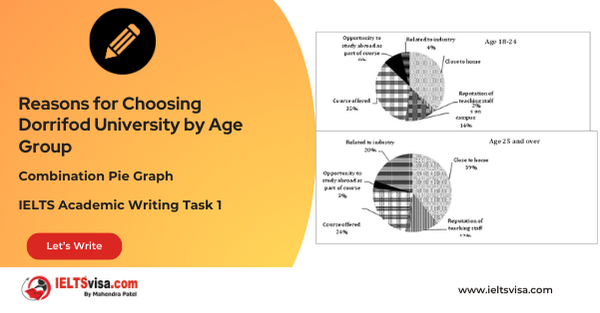
Reasons for Choosing Dorrifod University by Age Group IELTS Academic Writing Task 1 - Combination Pie Graph 20:00 Start Pause Stop IELTS Writing Task 1 Question The graphs below show the different reasons of two groups of students to choose Dorrifod University....
by iVenzu Technologies | Feb 11, 2025 | Bar Charts, Combinations, IELTS Academic Writing Task 1 Essay, Pie Charts
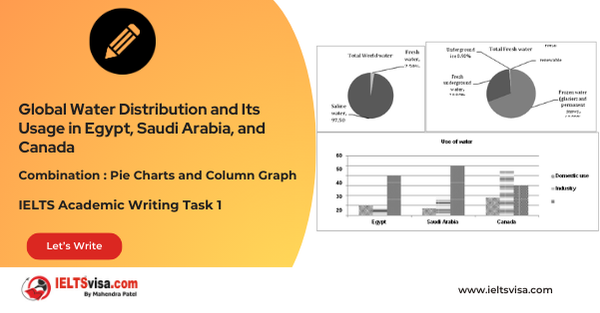
Global Water Distribution and Its Usage in Egypt, Saudi Arabia, and Canada IELTS Academic Writing Task 1 - Combination Pie Charts and Column Graph 20:00 Start Pause Stop IELTS Writing Task 1 Question The charts below give information about the amount and types of...