by iVenzu Technologies | Apr 8, 2025 | Bar Charts, Combinations, IELTS Academic Writing Task 1 Essay, Pie Charts
Percentage of Young People Enrolled in Universities in 2000 and 2007 IELTS Academic Writing Task 1 - Column Graph 20:00 Start Pause Stop IELTS Writing Task 1 Question The chart below shows the percentage of young people at a university in 2000 and 2007....
by iVenzu Technologies | Apr 7, 2025 | IELTS Academic Writing Task 1 Essay, Pie Charts
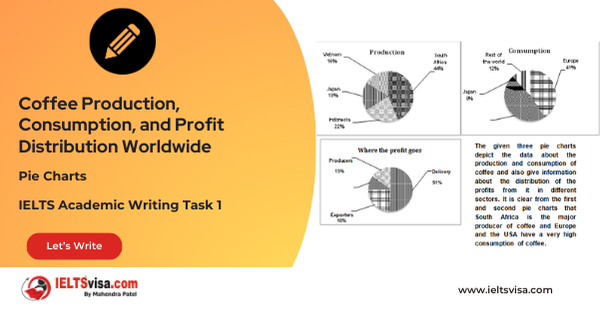
Coffee Production, Consumption, and Profit Distribution Worldwide IELTS Academic Writing Task 1 - Pie Charts 20:00 Start Pause Stop IELTS Writing Task 1 Question The graphs below show the development of the cutting tools made by stone, one was made 1.4...
by iVenzu Technologies | Apr 5, 2025 | Bar Charts, Combinations, IELTS Academic Writing Task 1 Essay, Pie Charts
Types of Transport Used by Tourists Visiting New Zealand from Five Countries in 2004. IELTS Academic Writing Task 1 - Column Graph 20:00 Start Pause Stop IELTS Writing Task 1 Question The graph below shows the types of transport used by tourists who...
by iVenzu Technologies | Apr 5, 2025 | Bar Charts, Combinations, IELTS Academic Writing Task 1 Essay, Pie Charts
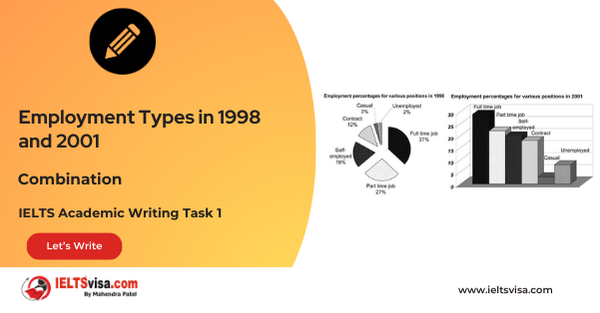
Employment Types in 1998 and 2001 IELTS Academic Writing Task 1 - Diagram 20:00 Start Pause Stop IELTS Writing Task 1 Question Write a report for a university tutor describing the information shown. Common Questions for the Combination 1. Diagram Type:...
by Mahendra Patel | Mar 12, 2025 | IELTS Academic Writing Task 1 Essay, Pie Charts
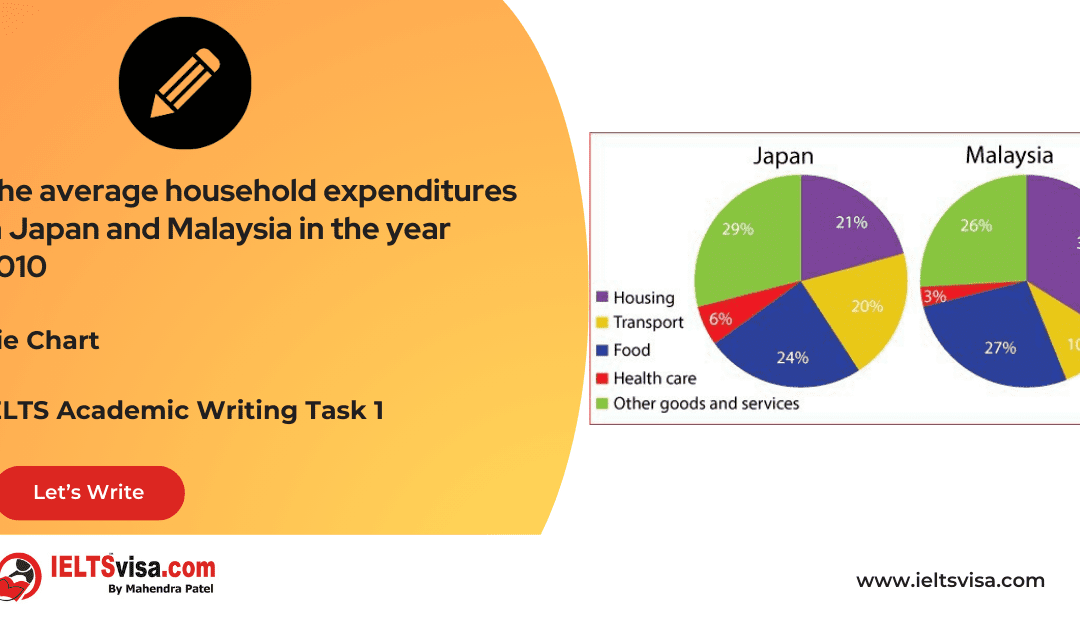
The average household expenditures in Japan and Malaysia in the year 2010 IELTS Academic Writing Task 1 - Pie Chart 20:00 Start Pause Stop IELTS Writing Task 1 Question The average household expenditures in Japan and Malaysia in the year 2010 Common...
by Mahendra Patel | Mar 11, 2025 | IELTS Academic Writing Task 1 Essay, Pie Charts
How much money is spent in the budget on different sectors by the UAE government in 2000 IELTS Academic Writing Task 1 - Pie-Charts 20:00 Start Pause Stop IELTS Writing Task 1 Question The chart below shows how much money is spent in the budget on...