Relating to people within 15-minute drive service in a particular region in UK IELTS Academic Writing Task 1 - Bar Graph 20:00 Start Pause Stop IELTS Writing Task 1 Question The chart shows the information relating to people within 15-minute drive...
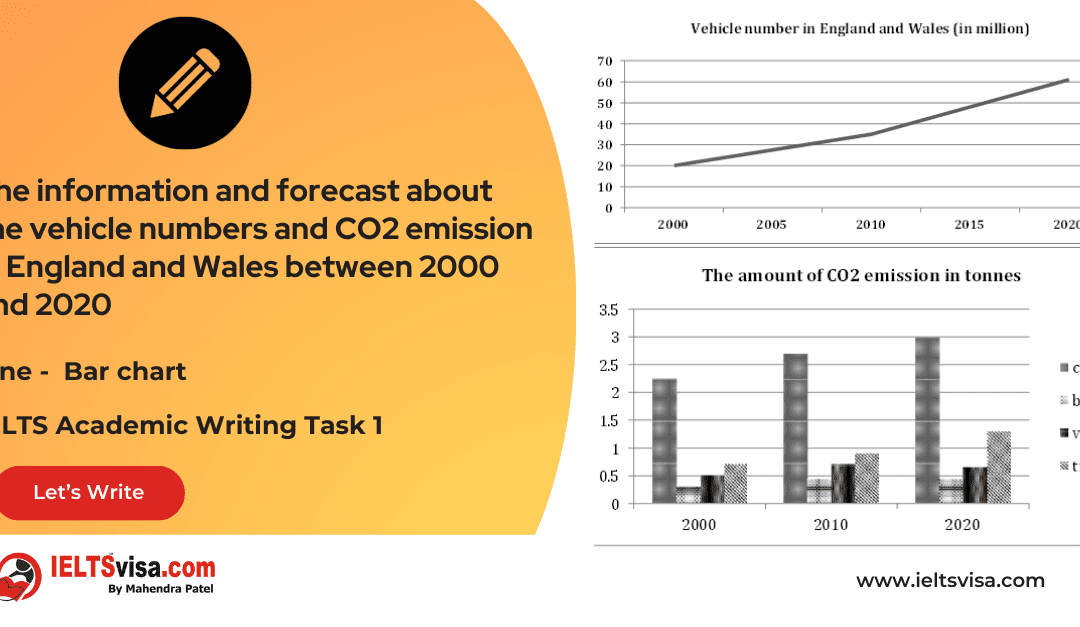
The information and forecast about the vehicle numbers and CO2 emission in England and Wales between 2000 and 2020 IELTS Academic Writing Task 1 - Line Graph 20:00 Start Pause Stop IELTS Writing Task 1 Question The line graph and the bar chart give the...
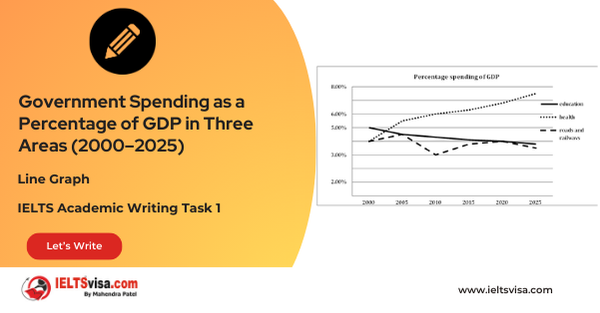
Government Spending as a Percentage of GDP in Three Areas (2000–2025) IELTS Academic Writing Task 1 - Line Graph 20:00 Start Pause Stop IELTS Writing Task 1 Question The given graph shows the past and projected figures of the government spending as a percentage of GDP...
The percentage of workforce employed in six industries in Australia between 1989 and 2009 IELTS Academic Writing Task 1 - Tables 20:00 Start Pause Stop IELTS Writing Task 1 Question The table below gives information about the percentage of workforce...
The number of international students from different resource countries in Canada and the USA in two school years IELTS Academic Writing Task 1 - Tables 20:00 Start Pause Stop IELTS Writing Task 1 Question The number of international students from...
The information on waste disposal in a European country from 2005 to 2008 IELTS Academic Writing Task 1 - Bar Graph 20:00 Start Pause Stop IELTS Writing Task 1 Question The graph below shows the information on waste disposal in a European country from 2005 to 2008....