Housing Preferences in British Cities in 2005 IELTS Academic Writing Task 1 - Bar Graph 20:00 Start Pause Stop IELTS Writing Task 1 Question The chart below illustrates the result of a British survey on the types of houses people liked, taken in 2005. Summarise the...
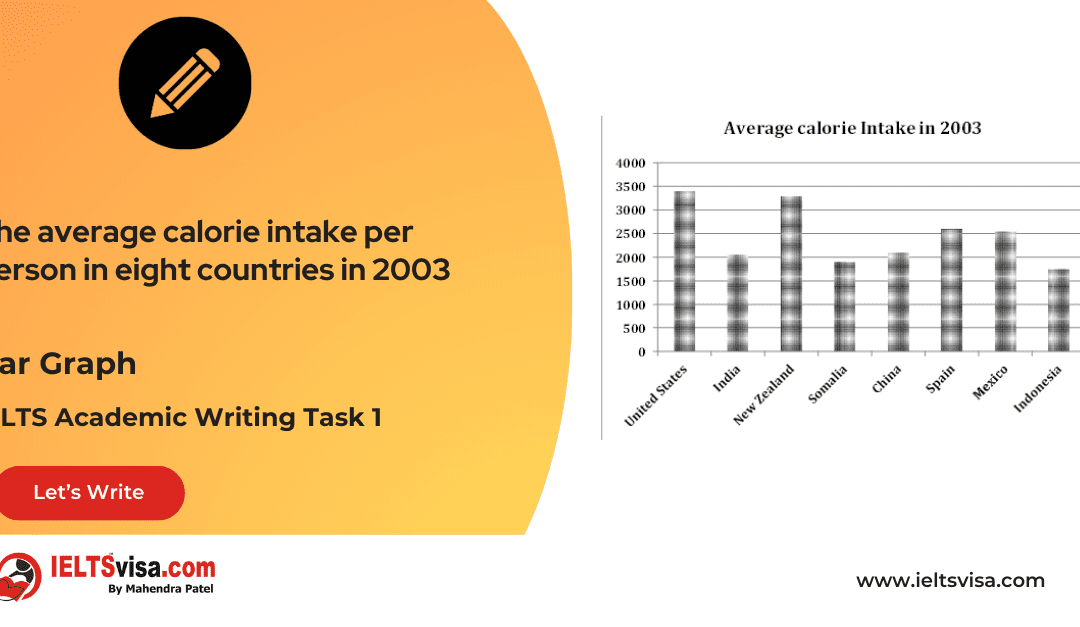
The average calorie intake per person in eight countries in 2003 IELTS Academic Writing Task 1 - Bar Graph 20:00 Start Pause Stop IELTS Writing Task 1 Question The graph below shows the average calorie intake per person in eight countries in 2003....
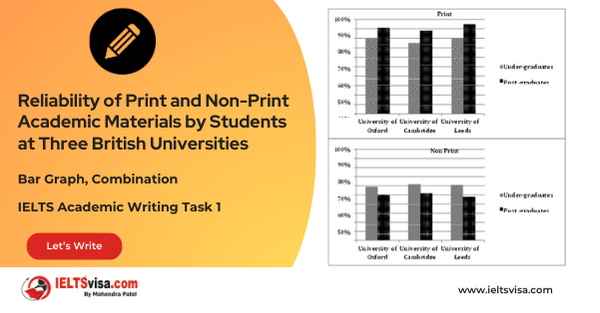
Reliability of Print and Non-Print Academic Materials by Students at Three British Universities IELTS Academic Writing Task 1 - Combination Bar Graph 20:00 Start Pause Stop IELTS Writing Task 1 Question The following graphs depict the reliability of print and...
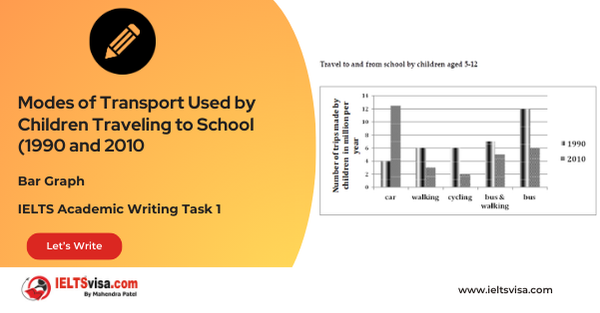
Modes of Transport Used by Children Traveling to School (1990 and 2010) IELTS Academic Writing Task 1 - Bar Graph 20:00 Start Pause Stop IELTS Writing Task 1 Question The graph below shows the number of trips made by children in one country to travel to and from...
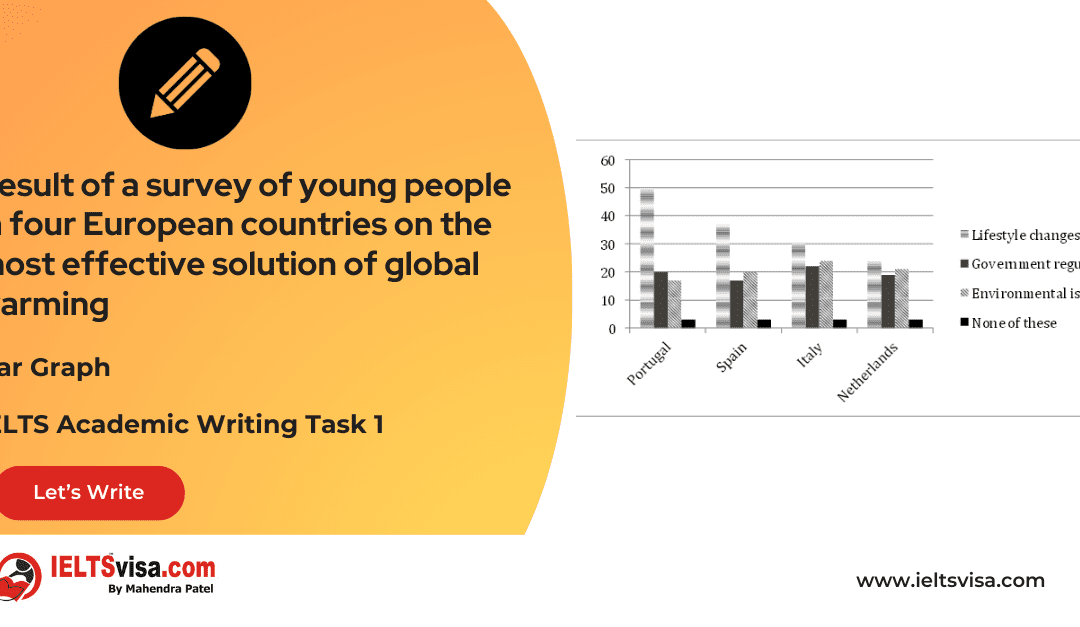
Result of a survey of young people in four European countries on the most effective solution of global warming IELTS Academic Writing Task 1 - Bar Graph 20:00 Start Pause Stop IELTS Writing Task 1 Question The graph below shows the result of a survey of...
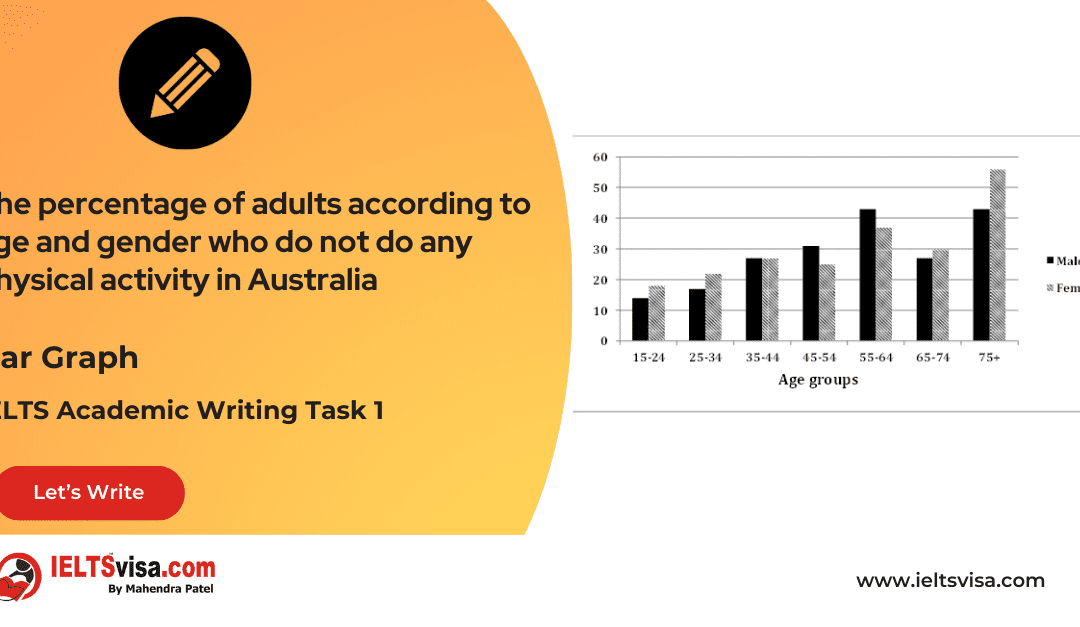
The percentage of adults according to age and gender who do not do any physical activity in Australia IELTS Academic Writing Task 1 - Bar Graph 20:00 Start Pause Stop IELTS Writing Task 1 Question The graph below shows the percentage of adults according...