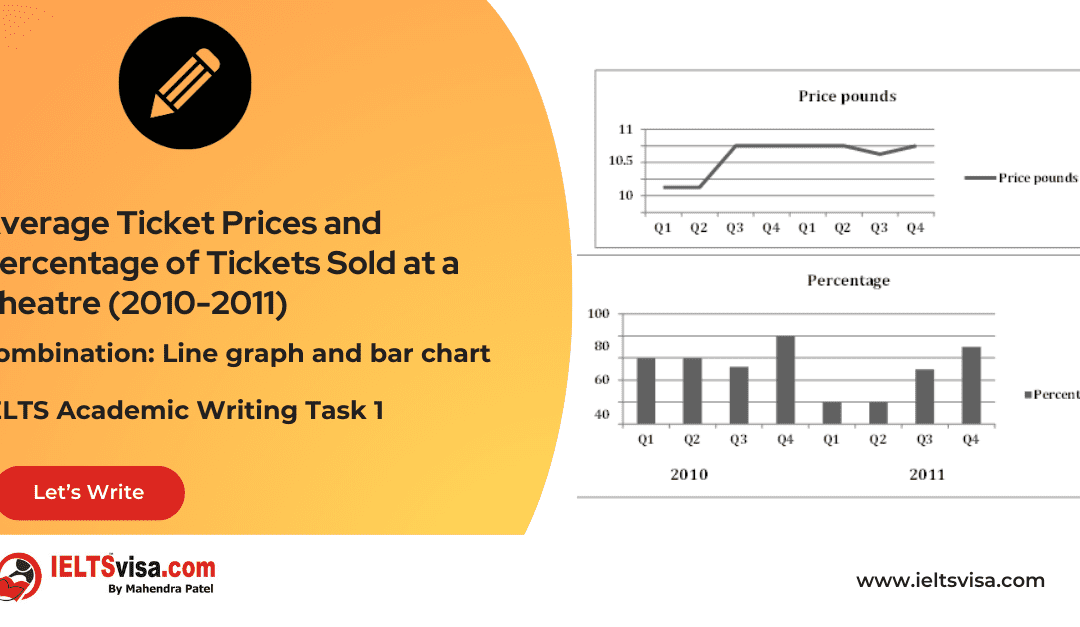
Average Ticket Prices and Percentage of Tickets Sold at a Theatre (2010-2011) IELTS Academic Writing Task 1 - Combination: Line graph and bar chart 20:00 Start Pause Stop IELTS Writing Task 1 Question The line graph shows the average prices of tickets sold at a...
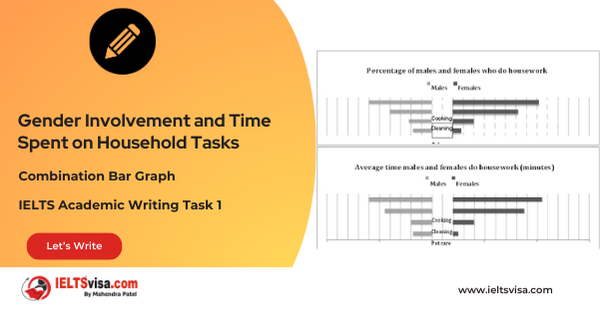
Gender Involvement and Time Spent on Household Tasks IELTS Academic Writing Task 1 - Combination Bar Graph 20:00 Start Pause Stop IELTS Writing Task 1 Question The first chart below shows the percentages of women and men in a country involved in some kinds of home...
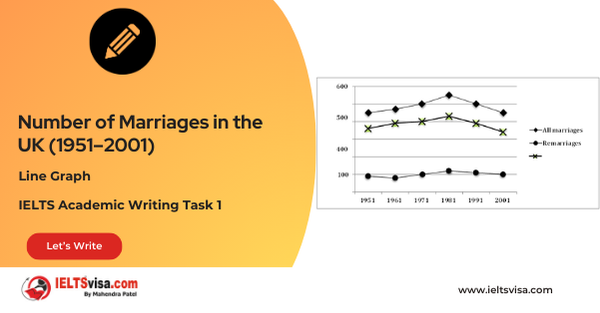
Number of Marriages in the UK (1951–2001) IELTS Academic Writing Task 1 - Line Graph 20:00 Start Pause Stop IELTS Writing Task 1 Question The diagram below shows the number of marriages in the UK between 1951 and 2001. The data given is for all marriages, remarriages...
The percentage of 18-25 year olds in universities in four different countries IELTS Academic Writing Task 1 - Line Graph 20:00 Start Pause Stop IELTS Writing Task 1 Question The graph below shows the percentage of 18-25 year olds in universities in four...
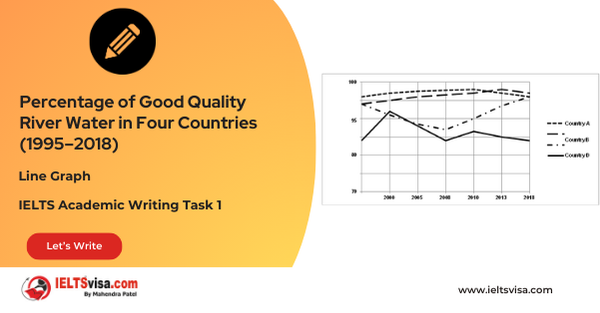
Percentage of Good Quality River Water in Four Countries (1995–2018) IELTS Academic Writing Task 1 - Line Graph 20:00 Start Pause Stop IELTS Writing Task 1 Question The diagram below shows the percentage of good quality river water in four countries from 1995 to 2010....
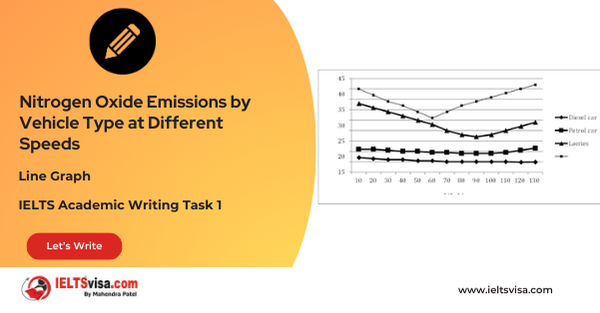
Nitrogen Oxide Emissions by Vehicle Type at Different Speeds IELTS Academic Writing Task 1 - Line Graph 20:00 Start Pause Stop IELTS Writing Task 1 Question The given graph shows the nitrogen oxide emissions produced by four vehicles. Summarise the information by...