by Mahendra Patel | Feb 15, 2025 | Bar Charts, Combinations, IELTS Academic Writing Task 1 Essay, Tables
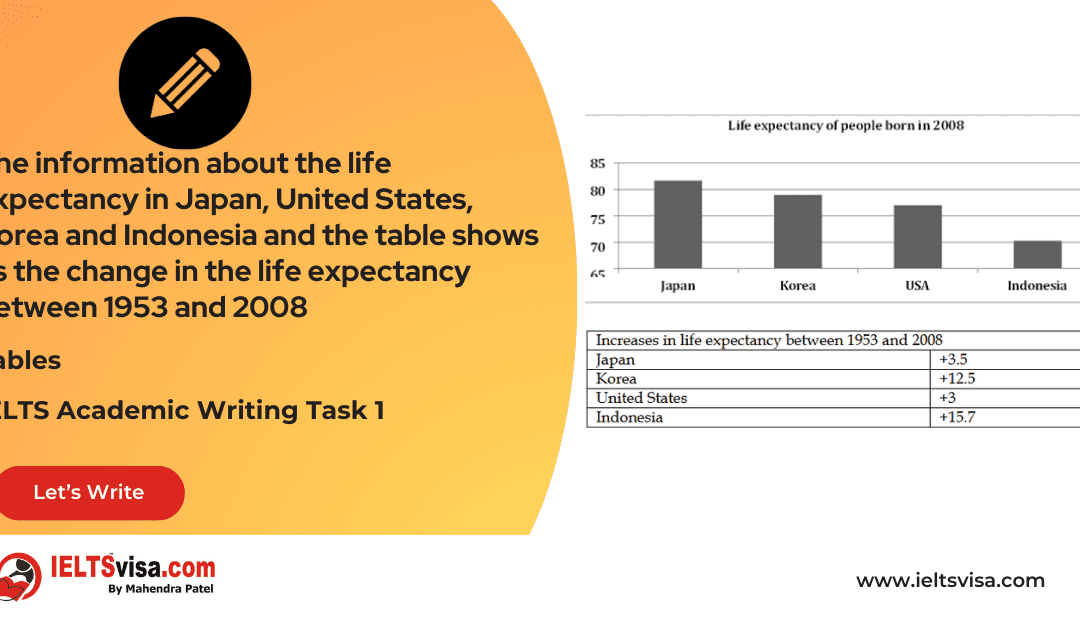
The information about the life expectancy in Japan, United States, Korea and Indonesia and the table shows us the change in the life expectancy between 1953 and 2008 IELTS Academic Writing Task 1 - Table 20:00 Start Pause Stop IELTS Writing Task 1...
by Mahendra Patel | Feb 15, 2025 | Bar Charts, Combinations, IELTS Academic Writing Task 1 Essay
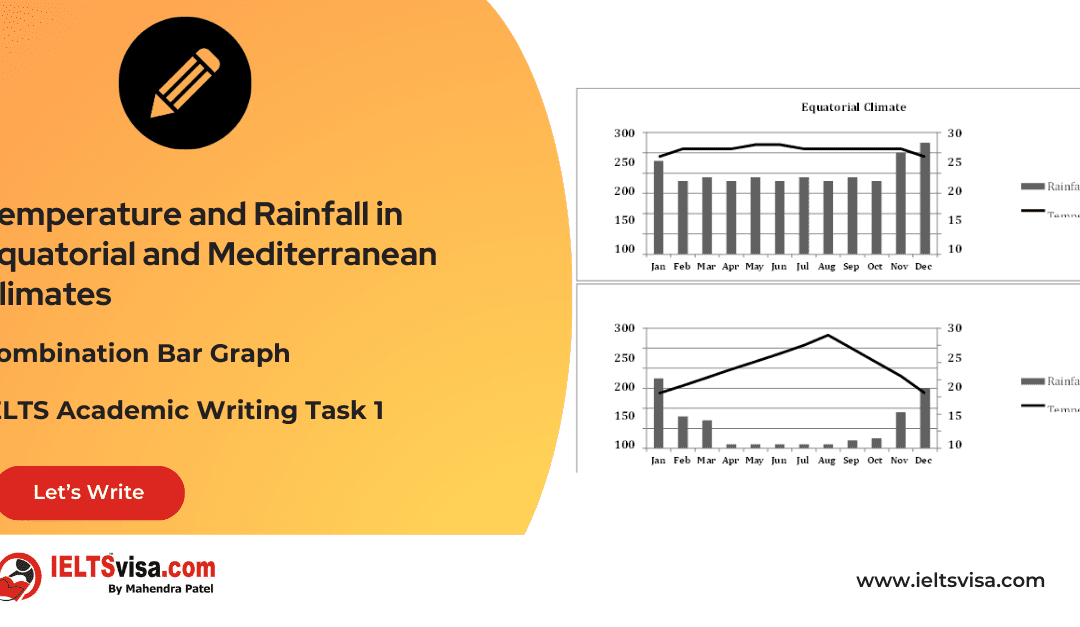
Temperature and Rainfall in Equatorial and Mediterranean Climates IELTS Academic Writing Task 1 - Combination Bar Graph 20:00 Start Pause Stop IELTS Writing Task 1 Question The charts below show temperature and rainfall in Equatorial climate and Mediterranean climate...
by Mahendra Patel | Feb 14, 2025 | Bar Charts, Combinations, IELTS Academic Writing Task 1 Essay
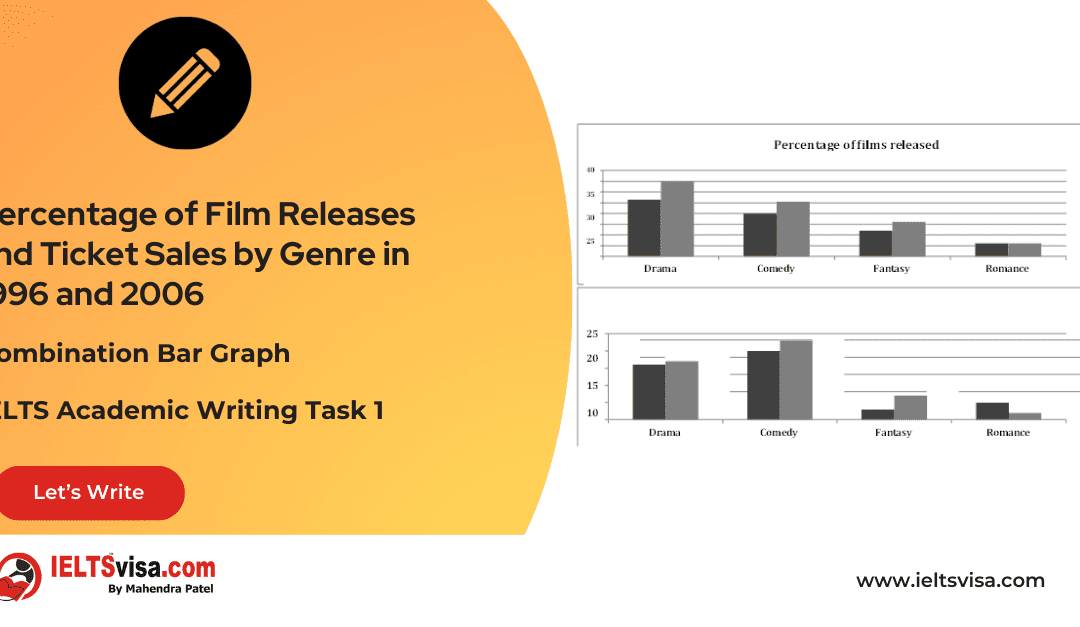
Percentage of Film Releases and Ticket Sales by Genre in 1996 and 2006 IELTS Academic Writing Task 1 - Combination Bar Graph 20:00 Start Pause Stop IELTS Writing Task 1 Question The diagram below shows the changes, which took place in a coastal area called Pentland...
by Mahendra Patel | Feb 13, 2025 | Bar Charts, Combinations, IELTS Academic Writing Task 1 Essay, Line Graphs
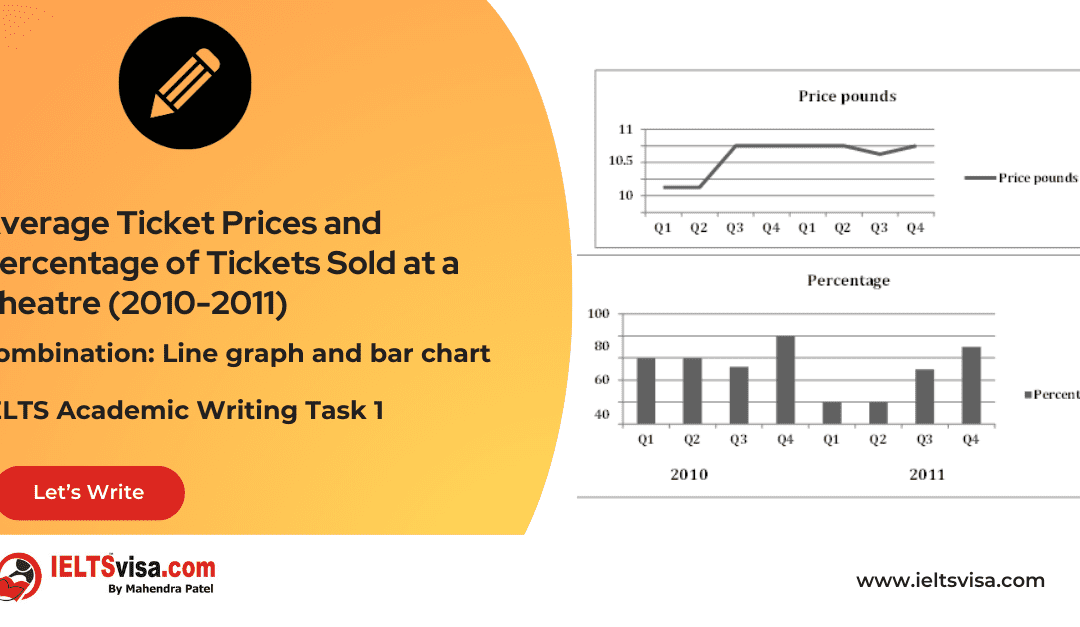
Average Ticket Prices and Percentage of Tickets Sold at a Theatre (2010-2011) IELTS Academic Writing Task 1 - Combination: Line graph and bar chart 20:00 Start Pause Stop IELTS Writing Task 1 Question The line graph shows the average prices of tickets sold at a...
by Mahendra Patel | Feb 12, 2025 | Combinations, IELTS Academic Writing Task 1 Essay
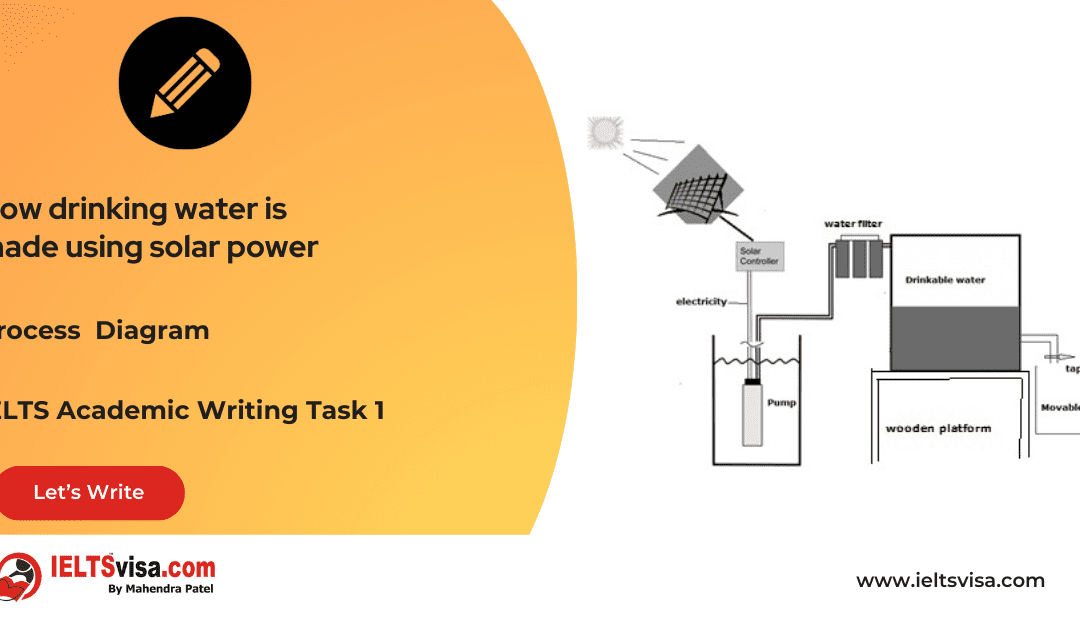
How drinking water is made using solar power IELTS Academic Writing Task 1 - Process Diagram 20:00 Start Pause Stop IELTS Writing Task 1 Question The process below shows how drinking water is made using solar power. Write a report for a university...
by iVenzu Technologies | Feb 11, 2025 | Combinations, IELTS Academic Writing Task 1 Essay, Pie Charts
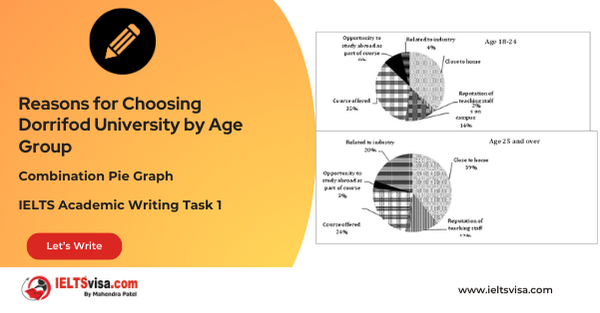
Reasons for Choosing Dorrifod University by Age Group IELTS Academic Writing Task 1 - Combination Pie Graph 20:00 Start Pause Stop IELTS Writing Task 1 Question The graphs below show the different reasons of two groups of students to choose Dorrifod University....