by iVenzu Technologies | Apr 8, 2025 | Bar Charts, Combinations, IELTS Academic Writing Task 1 Essay, Pie Charts
Percentage of Young People Enrolled in Universities in 2000 and 2007 IELTS Academic Writing Task 1 - Column Graph 20:00 Start Pause Stop IELTS Writing Task 1 Question The chart below shows the percentage of young people at a university in 2000 and 2007....
by iVenzu Technologies | Apr 5, 2025 | Bar Charts, Combinations, IELTS Academic Writing Task 1 Essay, Pie Charts
Types of Transport Used by Tourists Visiting New Zealand from Five Countries in 2004. IELTS Academic Writing Task 1 - Column Graph 20:00 Start Pause Stop IELTS Writing Task 1 Question The graph below shows the types of transport used by tourists who...
by iVenzu Technologies | Apr 5, 2025 | Bar Charts, Combinations, IELTS Academic Writing Task 1 Essay, Pie Charts
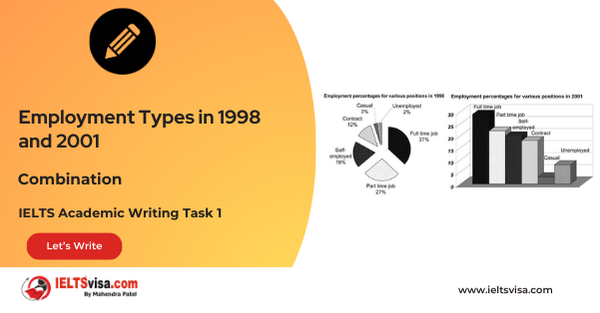
Employment Types in 1998 and 2001 IELTS Academic Writing Task 1 - Diagram 20:00 Start Pause Stop IELTS Writing Task 1 Question Write a report for a university tutor describing the information shown. Common Questions for the Combination 1. Diagram Type:...
by iVenzu Technologies | Mar 5, 2025 | Combinations, IELTS Academic Writing Task 1 Essay
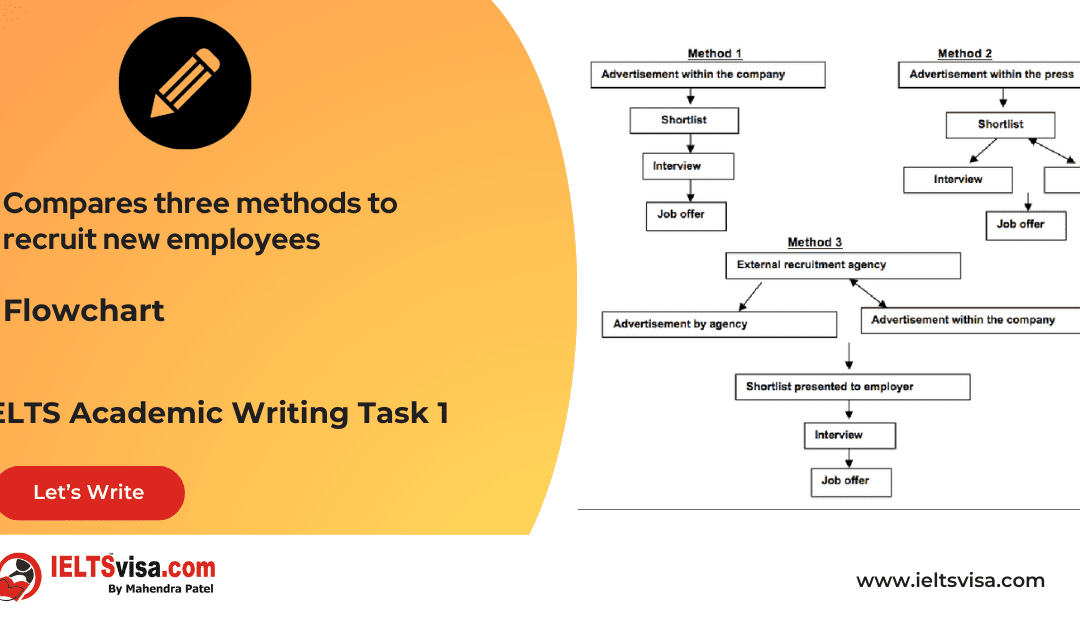
The information by selecting and reporting the main features, and make comparisons where relevant IELTS Academic Writing Task 1 - Process Diagram 20:00 Start Pause Stop IELTS Writing Task 1 Question The flowchart below compares three methods to recruit...
by Mahendra Patel | Feb 16, 2025 | Bar Charts, Combinations, IELTS Academic Writing Task 1 Essay
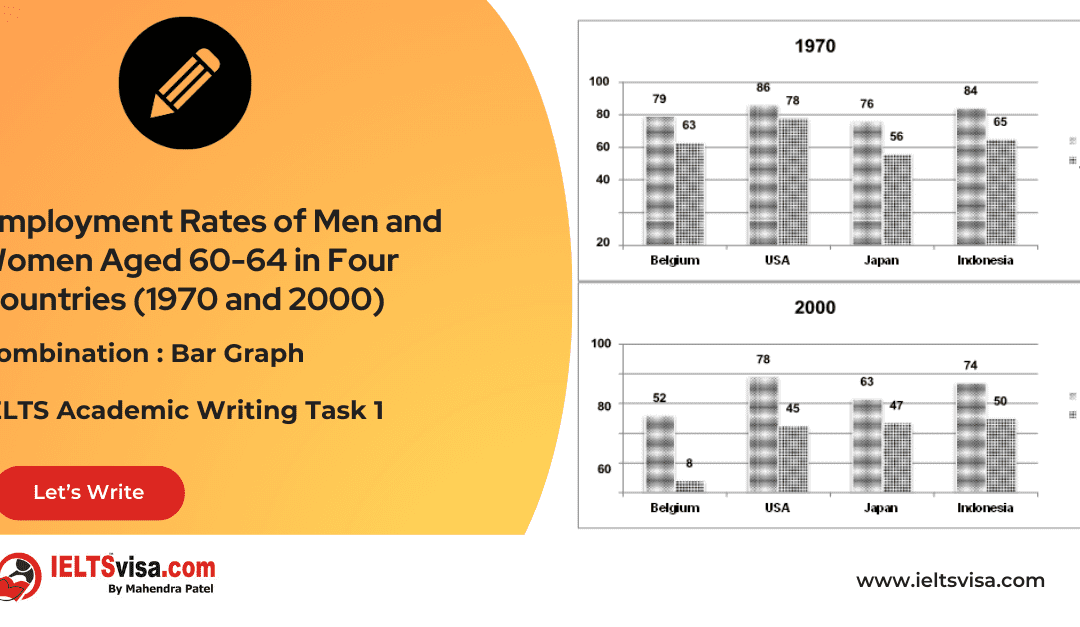
Employment Rates of Men and Women Aged 60-64 in Four Countries (1970 and 2000) IELTS Academic Writing Task 1 - Combination : Bar Graph 20:00 Start Pause Stop IELTS Writing Task 1 Question The graphs below show the percentage of men and women aged 60-64 who were...
by Mahendra Patel | Feb 16, 2025 | Bar Charts, Combinations, IELTS Academic Writing Task 1 Essay, Tables
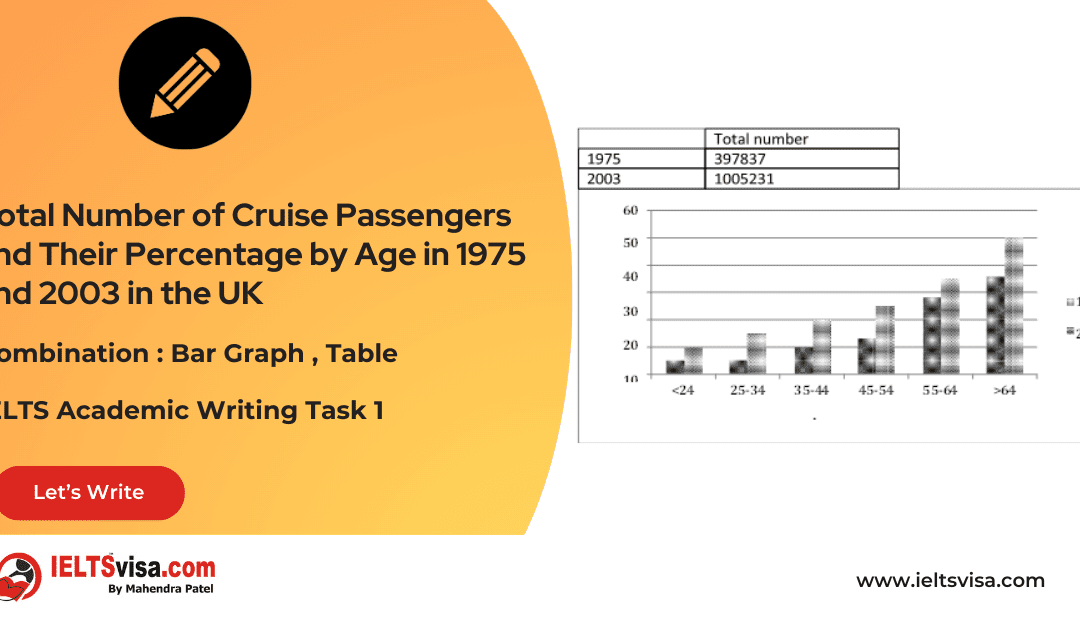
Total Number of Cruise Passengers and Their Percentage by Age in 1975 and 2003 in the UK IELTS Academic Writing Task 1 - Combination : Bar Graph , Table 20:00 Start Pause Stop IELTS Writing Task 1 Question 120. The charts below show the total number of cruise...