by iVenzu Technologies | Feb 28, 2025 | Bar Charts, IELTS Academic Writing Task 1 Essay
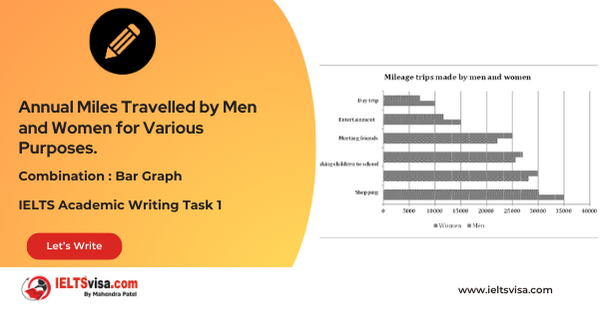
Annual Miles Travelled by Men and Women for Various Purposes. IELTS Academic Writing Task 1 - Pie Charts 20:00 Start Pause Stop IELTS Writing Task 1 Question The bar chart below shows the number of miles travelled in a year by men and women for six...
by Yash Patel | Feb 20, 2025 | Bar Charts, IELTS Academic Writing Task 1 Essay
Average Retirement Age for Men and Women in 2004 and 2008 in six different countries IELTS Academic Writing Task 1 - Bar Graph 20:00 Start Pause Stop IELTS Writing Task 1 Question The chart below shows the percentage of UK households with selected consumer durables...
by Mahendra Patel | Feb 16, 2025 | Bar Charts, IELTS Academic Writing Task 1 Essay
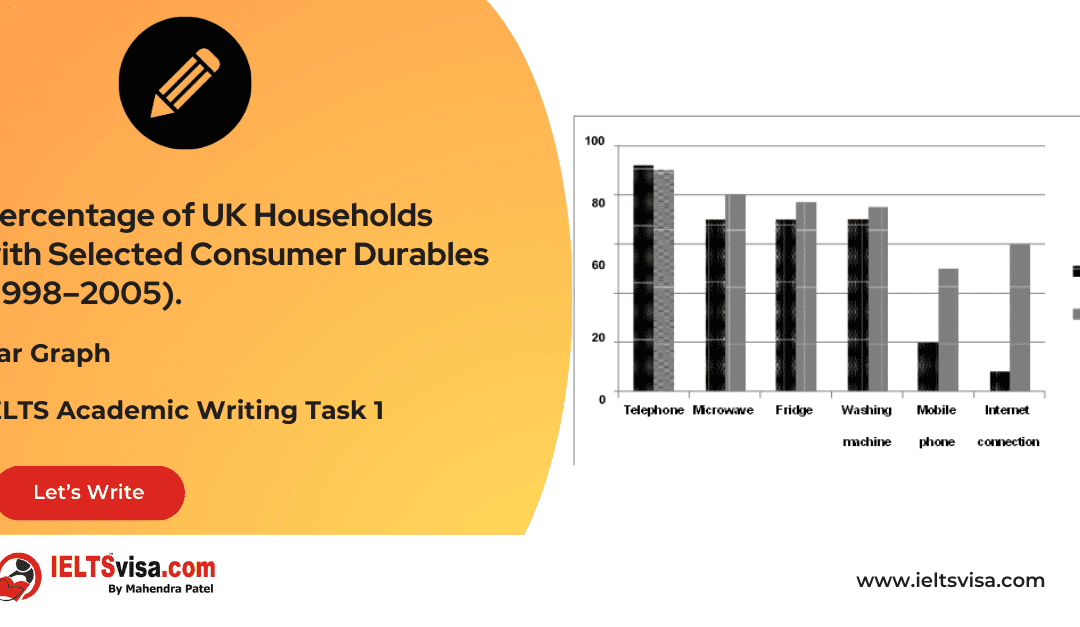
Percentage of UK Households with Selected Consumer Durables (1998–2005) IELTS Academic Writing Task 1 - Bar Graph 20:00 Start Pause Stop IELTS Writing Task 1 Question The chart below shows the percentage of UK households with selected consumer durables between 1998...
by Mahendra Patel | Feb 16, 2025 | Bar Charts, IELTS Academic Writing Task 1 Essay
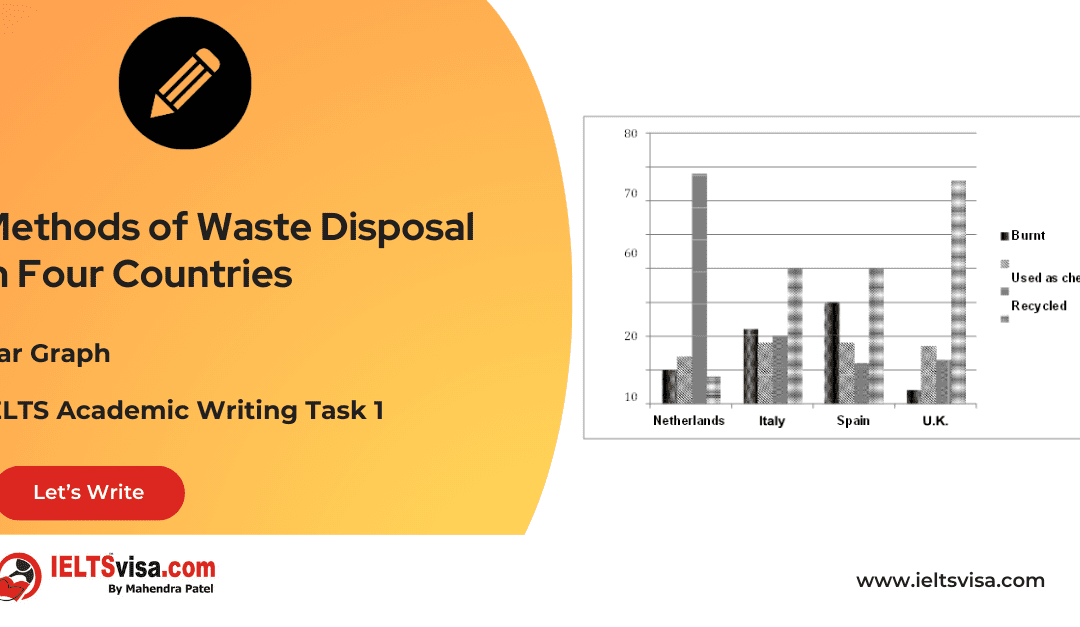
Methods of Waste Disposal in Four Countries IELTS Academic Writing Task 1 - Bar Graph 20:00 Start Pause Stop IELTS Writing Task 1 Question The graph below shows four methods of dealing with waste in four countries. Common questions for the waste disposal graph 1....
by Mahendra Patel | Feb 16, 2025 | Bar Charts, Combinations, IELTS Academic Writing Task 1 Essay
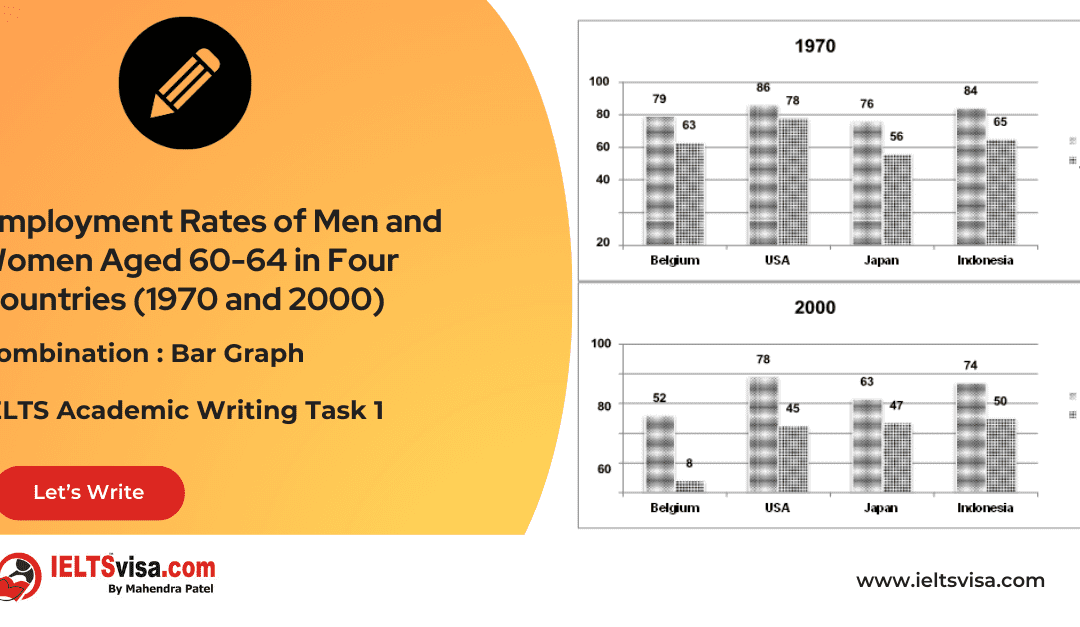
Employment Rates of Men and Women Aged 60-64 in Four Countries (1970 and 2000) IELTS Academic Writing Task 1 - Combination : Bar Graph 20:00 Start Pause Stop IELTS Writing Task 1 Question The graphs below show the percentage of men and women aged 60-64 who were...
by Mahendra Patel | Feb 16, 2025 | Bar Charts, IELTS Academic Writing Task 1 Essay
Percentage of Immigrants to Australia from Five Countries in 1962, 1982, and 2002 IELTS Academic Writing Task 1 - Bar Graph 20:00 Start Pause Stop IELTS Writing Task 1 Question The graph below shows the percentage of immigrants to Australia from five countries in...