by Yash Patel | Mar 10, 2025 | Bar Charts, IELTS Academic Writing Task 1 Essay
Sales Percentage of Book Types from 1972 to 2012 IELTS Academic Writing Task 1 - Bar Charts 20:00 Start Pause Stop IELTS Writing Task 1 Question The charts below show the percentage of five kinds of books sold by a bookseller between 1972 and 2012....
by Yash Patel | Mar 9, 2025 | Bar Charts, IELTS Academic Writing Task 1 Essay
Comparison of Males Preferring Watching vs. Participating in Sports IELTS Academic Writing Task 1 - Bar Graph 20:00 Start Pause Stop IELTS Writing Task 1 Question The column graph shows the percentage of males in a particular country who prefer watching...
by Yash Patel | Mar 6, 2025 | Bar Charts, IELTS Academic Writing Task 1 Essay
Cinema Attendance on Different Days of the Week (2003, 2005, 2007) IELTS Academic Writing Task 1 - Bar Graph 20:00 Start Pause Stop IELTS Writing Task 1 Question The graph below shows the cinema attendance of people on different days of the week in 2003,...
by Yash Patel | Mar 6, 2025 | Bar Charts, IELTS Academic Writing Task 1 Essay
Average Hours of Housework Done by Women and Men by Employment Status IELTS Academic Writing Task 1 - Bar Graph 20:00 Start Pause Stop IELTS Writing Task 1 Question The bar chart below shows the average hours of housework done by women (unemployed, part...
by Mahendra Patel | Mar 5, 2025 | Bar Charts, IELTS Academic Writing Task 1 Essay
The weekly spending of an average family in a European country IELTS Academic Writing Task 1 - Bar Graph 20:00 Start Pause Stop IELTS Writing Task 1 Question The graph below shows the weekly spending of an average family in a European country. Summarise...
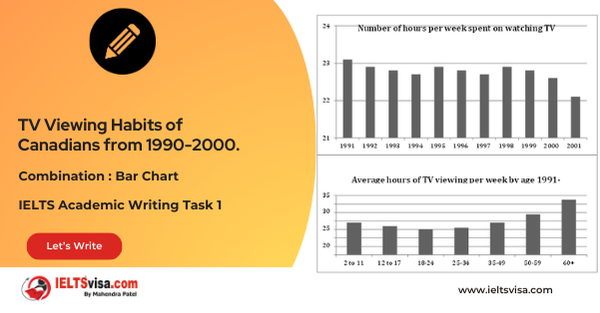
by iVenzu Technologies | Mar 1, 2025 | Bar Charts, IELTS Academic Writing Task 1 Essay
TV Viewing Habits of Canadians from 1990-2000. IELTS Academic Writing Task 1 - Bar Charts 20:00 Start Pause Stop IELTS Writing Task 1 Question The graphs below show the number of hours Canadians spend on watching TV from 1990 -2000. Summarise the...