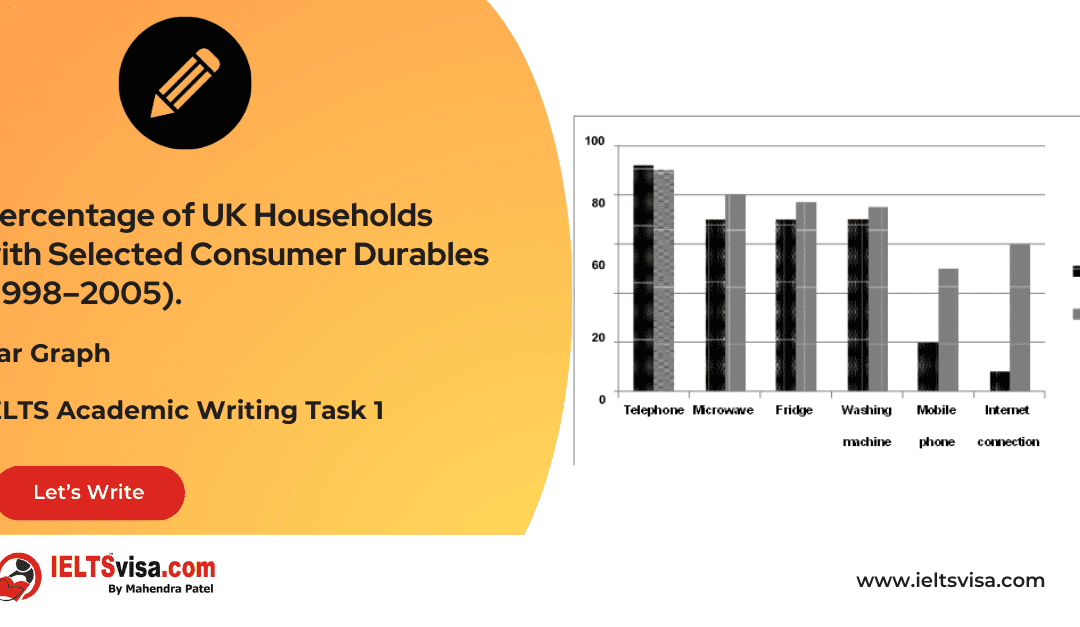
Percentage of UK Households with Selected Consumer Durables (1998–2005) IELTS Academic Writing Task 1 - Bar Graph 20:00 Start Pause Stop IELTS Writing Task 1 Question The chart below shows the percentage of UK households with selected consumer durables between 1998...
The process of canning of fish. IELTS Academic Writing Task 1 - Diagram 20:00 Start Pause Stop IELTS Writing Task 1 Question The diagram below shows the process of canning of fish. Write a report for a university lecturer describing the process below....
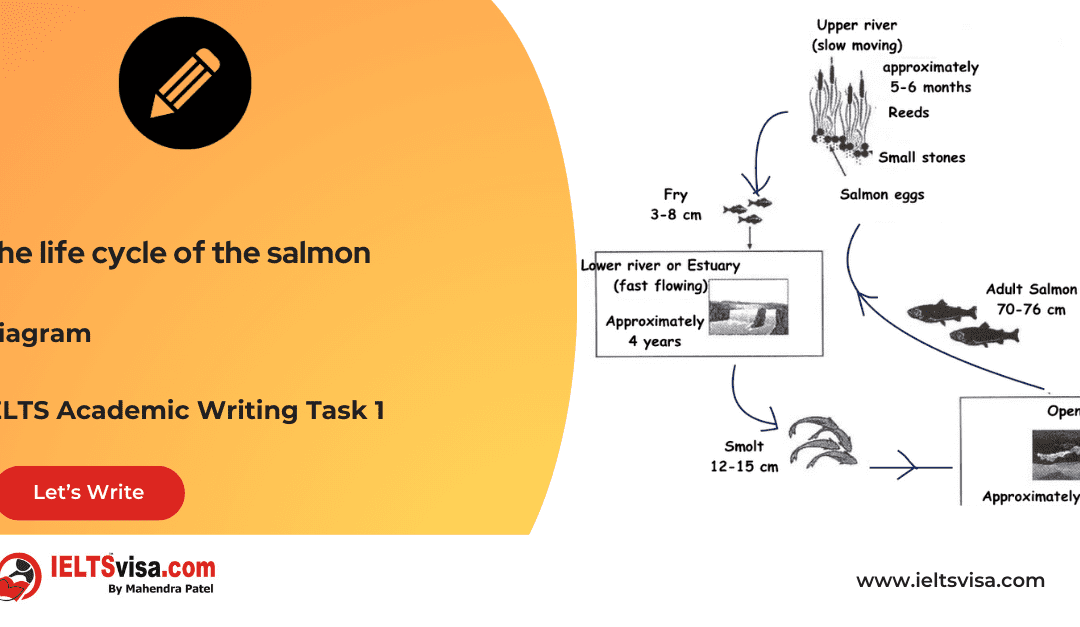
The life cycle of the salmon IELTS Academic Writing Task 1 - Diagram 20:00 Start Pause Stop IELTS Writing Task 1 Question The picture below shows the life cycle of the salmon. Summarise the information by selecting and reporting the main features and...
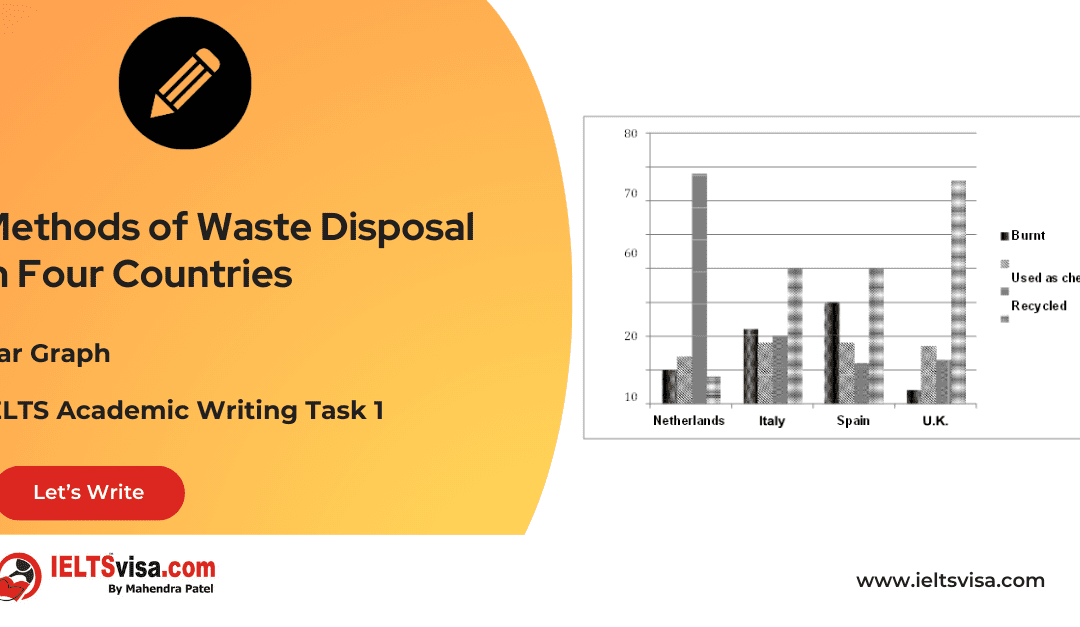
Methods of Waste Disposal in Four Countries IELTS Academic Writing Task 1 - Bar Graph 20:00 Start Pause Stop IELTS Writing Task 1 Question The graph below shows four methods of dealing with waste in four countries. Common questions for the waste disposal graph 1....
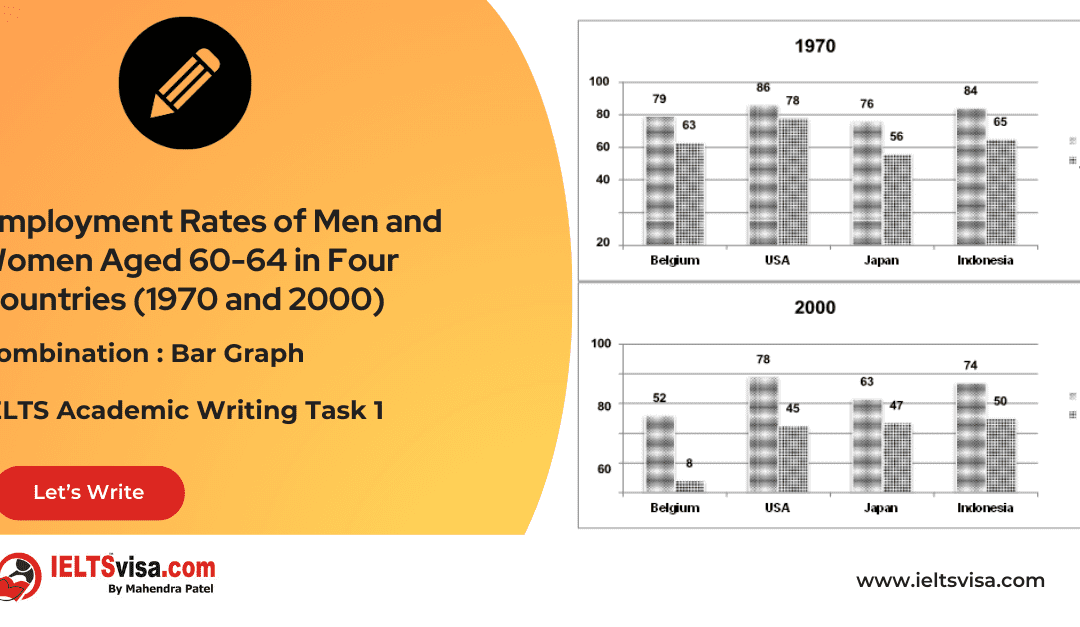
Employment Rates of Men and Women Aged 60-64 in Four Countries (1970 and 2000) IELTS Academic Writing Task 1 - Combination : Bar Graph 20:00 Start Pause Stop IELTS Writing Task 1 Question The graphs below show the percentage of men and women aged 60-64 who were...
Medical care in three European countries between 1980 and 2000 IELTS Academic Writing Task 1 - Table 20:00 Start Pause Stop IELTS Writing Task 1 Question The graph below shows the information about medical care in three European countries between 1980...