Time Spent on Activities by Working Adults in 1958 and 2008
IELTS Academic Writing Task 1 - Pie Chart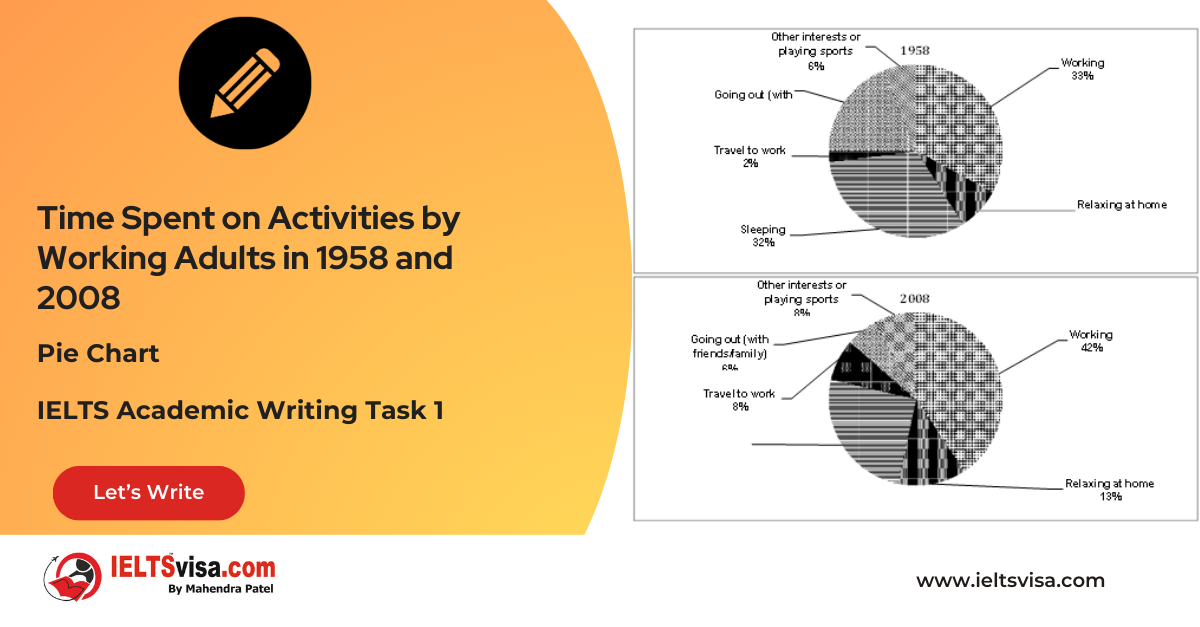
IELTS Writing Task 1 Question
The charts below show the percentage of time working adults spent on different activities in a particular country in 1958 and 2008.

Common Questions for the Activity Time Charts
1. Graph Types: Pie charts
2. Title: Time Spent on Activities by Working Adults in 1958 and 2008
3. What are the units of measurement?: Percentage (%)
4. Who: Working adults in a particular country
5. When: Years 1958 and 2008
6. Where: A specific country (unspecified)
7. Topic: Daily activity distribution of working adults
Process Showing and Trends
Comparison 1: Working Hours
- Details:
1. 1958:
o Time spent sleeping: 33%
2. 2008:
o Time spent sleeping: 42% (increase of 9%)
Comparison 2 : Sleeping Hours
- Details:
1. 1958:
o Time spent sleeping: 32%
2. 2008:
o Time spent sleeping: 25% (decrease of 7%)
Comparison 3 : Leisure Activities
- Details:
- Going Out:
- 1958: 19%
- 2008: 6% (decline of 13%)
- Relaxing at Home:
- 1958: 8%
- 2008: 13% (increase of 5%)
- Traveling to Work:
- 1958: 2%
- 2008: 8% (increase of 6%)
- Playing Sports or Hobbies:
- 1958: 6%
- 2008: 6% (no change)
Overall Comparison
- Details:
1. Working hours increased significantly, indicating a trend towards longer workdays.
2. Sleeping hours decreased, suggesting a shift in lifestyle that may require more waking hours for work.
3. The decline in time spent going out with friends and family reflects changing social habits.
4. Conversely, home relaxing became popular, indicating a preference for home-based leisure activities.
5. Travelling to work saw a notable increase, which might be attributed to longer commutes or increased work commitments.
Sample Answer
The two pie charts illustrate the distribution of daily activities for working adults in a specific country in 1958 and 2008.
In 1958, working adults allocated 33% of their day to work, with a similar proportion of time (32%) dedicated to sleeping. Socializing, such as going out with friends and family, occupied 19% of their time, while other activities, including commuting, hobbies, and relaxing at home, accounted for 16%.
By 2008, the scenario had changed considerably. The percentage of time spent working increased to 42%, representing a 9% rise. In contrast, the amount of time allocated to sleep decreased to 25%. The time spent going out for social activities saw a dramatic decline, dropping to just 6%, while the time dedicated to relaxing at home grew from 8% to 13%. Additionally, the time spent commuting to work increased from 2% to 8%, indicating that individuals were spending more time travelling. Interestingly, the time spent on sports and hobbies remained unchanged at 6%.
Overall, these charts highlight a significant shift in how working adults allocated their time over the 50-year period, with a notable increase in working hours and a growing preference for home-based relaxation.
Top 26 Vocabularies
| Vocabulary (type) | Meaning | Synonyms | Examples |
|
Allocation (noun) |
The distribution or assignment of resources |
Distribution, apportionment |
“The allocation of time for working increased significantly.” |
|
Decline (noun) |
A decrease or reduction in quantity |
Decrease, drop |
“There was a significant decline in time spent socializing.” |
|
Trend (noun) |
A general direction in which something is developing |
Movement, tendency |
“The trend showed a shift towards longer working hours.” |
|
Preference (noun) |
A greater liking for one alternative over others |
Favoritism, inclination |
“There was a clear preference for relaxing at home.” |
|
Occupation (noun) |
The action of taking up space or time |
Engagement, activity |
“Socializing occupied a considerable portion of their day.” |
|
Illustrate (verb) |
To explain or show something clearly |
Depict, demonstrate |
“The pie charts illustrate how daily activities changed between 1958 and 2008.” |
|
Proportion (noun) |
A part, share, or number considered in relation to a whole |
Share, percentage |
“A large proportion of time was dedicated to working in 2008.” |
|
Shift (noun) |
A change in position, direction, or trend |
Change, transition |
“There was a significant shift in time spent on social activities.” |
|
Increase (verb) |
To grow or become larger in size or number |
Rise, grow |
“The time allocated to work increased by 9% over the 50-year period.” |
|
Hobbies (noun) |
Activities done regularly for enjoyment |
Pastimes, interests |
“The percentage of time spent on hobbies remained constant over the years.” |
|
Relaxation (noun) |
The act of resting or unwinding |
Rest, leisure |
“Relaxation at home became a more prominent activity in 2008.” |
|
Commuting (verb) |
Traveling to and from work |
Traveling, journeying |
“The proportion of time spent commuting increased significantly to 8%.” |
|
Scenario (noun) |
A description of how things might happen |
Situation, case |
“The scenario in 2008 was notably different from 1958 in terms of daily activities.” |
|
Dramatic (adjective) |
Sudden and striking |
Significant, remarkable |
“There was a dramatic drop in the time spent on socializing.” |
|
Indicate (verb) |
To point out or show something |
Suggest, signify |
“The rise in commuting time indicates a change in work patterns.” |
|
Pattern (noun) |
A repeated or regular way in which something happens |
Model, trend |
“The pattern of daily activities showed a shift toward more home-based relaxation.” |
|
Dedicate (verb) |
To devote time or effort to a particular purpose |
Commit, allocate |
“Adults dedicated more time to working in 2008.” |
|
Engagement (noun) |
The act of being involved in an activity |
Involvement, participation |
“Social engagement decreased significantly over the 50-year period.” |
|
Comparison (noun) |
The act of examining similarities or differences |
Contrast, evaluation |
“The comparison between 1958 and 2008 shows changing priorities in daily activities.” |
|
Diminish (verb) |
To reduce or decrease in size, importance, or intensity |
Lessen, decline |
“The time spent on sleeping diminished from 32% to 25%.” |
|
Allocation (noun) |
The process of assigning resources or time |
Assignment, distribution |
“The allocation of time for commuting increased significantly.” |
|
Highlight (verb) |
To emphasize or make something noticeable |
Emphasize, underline |
“The charts highlight a growing preference for relaxing at home.” |
|
Notable (adjective) |
Worthy of attention or significant |
Remarkable, noteworthy |
“There was a notable increase in working hours between 1958 and 2008.” |
|
Preference (noun) |
A greater liking for one thing over another |
Inclination, favor |
“Adults showed a strong preference for spending time at home in 2008.” |
|
Consistent (adjective) |
Unchanging or remaining steady over time |
Constant, stable |
“The time spent on hobbies was consistent at 6% in both years.” |
|
Evolution (noun) |
The gradual development or change of something |
Progression, transformation |
“The evolution of daily routines reflects changes in work and lifestyle priorities.” |


Our Books

Master IELTS Speaking Part 1
IELTS Writing Task 1 Book
IELTS Writing Task 2 Book
Practice IELTS Other Modules
IELTS Listening
The IELTS Listening test assesses how well you can understand spoken English in various contexts. It lasts about 30 minutes and is divided into four sections with a total of 40 questions. The listening tasks become increasingly difficult as the test progresses.
IELTS Academic Reading
The IELTS Academic Reading section assesses your ability to understand and interpret a variety of texts in academic settings. It is designed to evaluate a range of reading skills, including skimming for gist, reading for main ideas, reading for detail, understanding inferences, and recognizing a writer's opinions and arguments.
IELTS Speaking
The IELTS Speaking test assesses your ability to communicate in English on everyday topics. It lasts 11-14 minutes and consists of three parts: introduction, cue card, and a discussion based on the cue card topic.
IELTS General Reading
IELTS General Reading tests your ability to understand and interpret various types of texts. Here are some key areas and types of content you can expect to encounter in the reading section, along with tips for effective preparation.
IELTS Academic Writing Task 1
In IELTS Academic Writing Task 1, you are presented with a visual representation of information, such as graphs, charts, tables, or diagrams, and you are required to summarize, compare, or explain the data in your own words.
IELTS General Writing Task 1
In IELTS General Writing Task 1, you are required to write a letter based on a given situation. The letter can be formal, semi-formal, or informal, depending on the prompt. Here’s a breakdown of the key components to include in your letter
IELTS Academic Writing Task 2
In IELTS Academic Writing Task 2, you are required to write an essay in response to a question or topic. Here’s a guide to help you understand the essential elements of this task
IELTS Exam Tips
To succeed in the IELTS exam, practice regularly, familiarize yourself with the test format, improve your vocabulary, develop time management skills, and take mock tests to build confidence.
Grammer for IELTS
Grammar is the foundation of effective communication in English. Understanding tense usage, subject-verb agreement, and sentence structure enhances clarity and coherence in writing and speaking.
Vocabulary for IELTS
Vocabulary plays a crucial role in the IELTS (International English Language Testing System) exam, especially in the Speaking and Writing sections. Here’s an overview of why vocabulary is important and how it impacts your performance
RECENT IELTS SAMPLES QUESTIONS AND ANSWERS
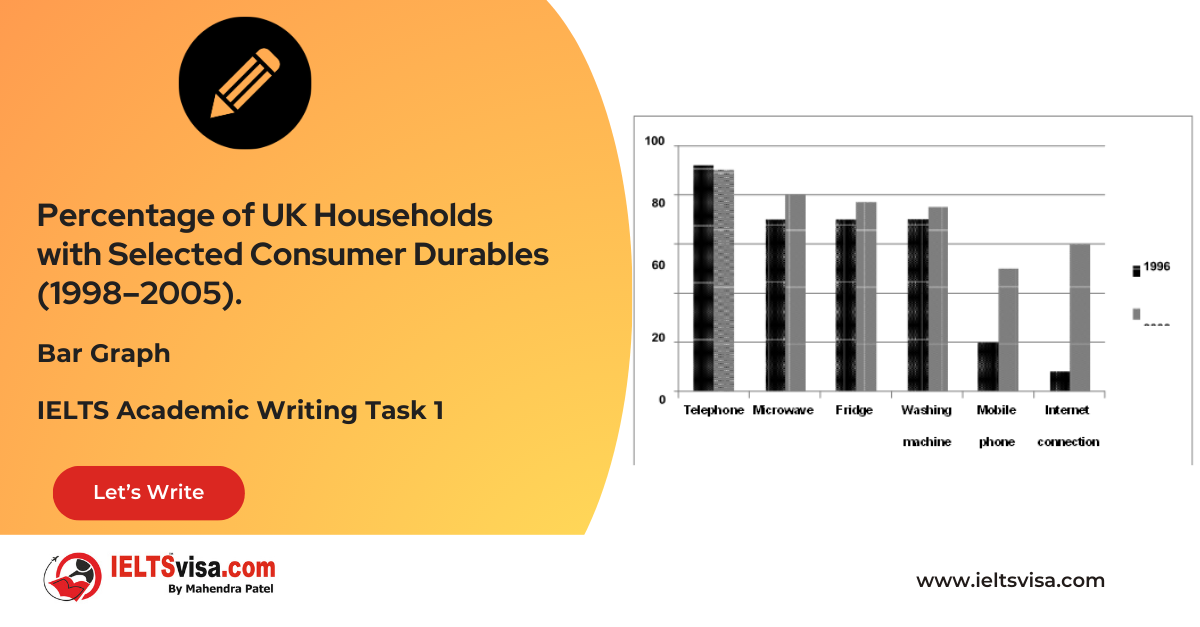
Task 1 – Bar Graph – Percentage of UK Households with Selected Consumer Durables (1998–2005).
[df_adh_heading title_infix="IELTS Writing Task 1 Question" use_divider="on"...
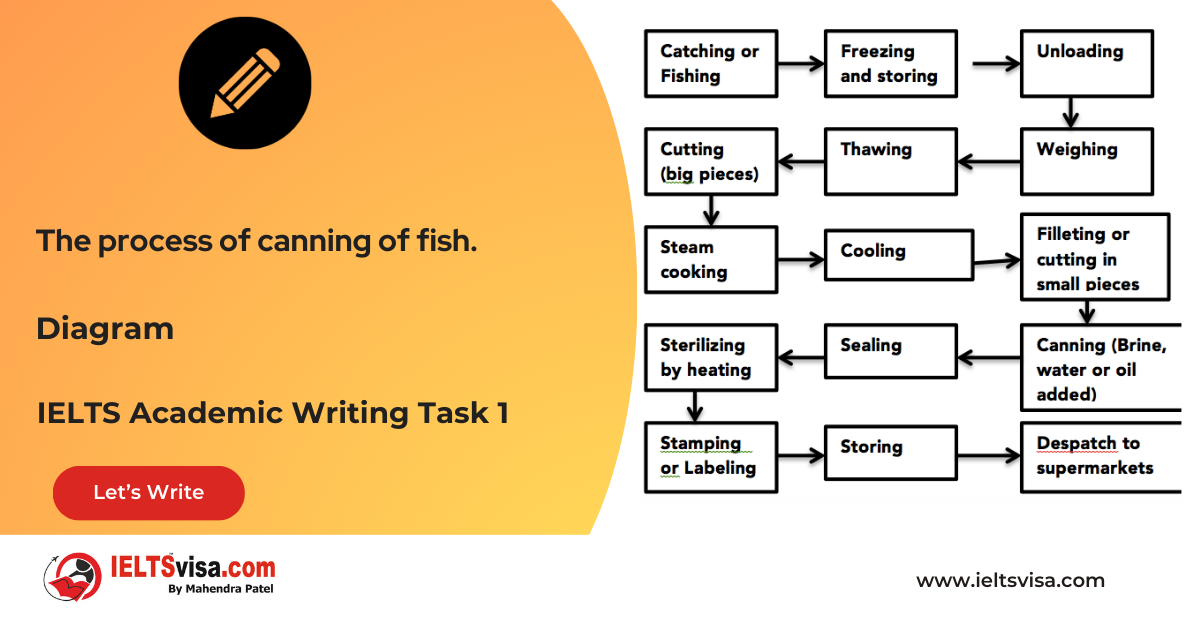
Task 1 – Diagram – The process of canning of fish.
20:00 Start Pause Stop [df_adh_heading title_infix="IELTS Writing Task 1 Question" use_divider="on"...
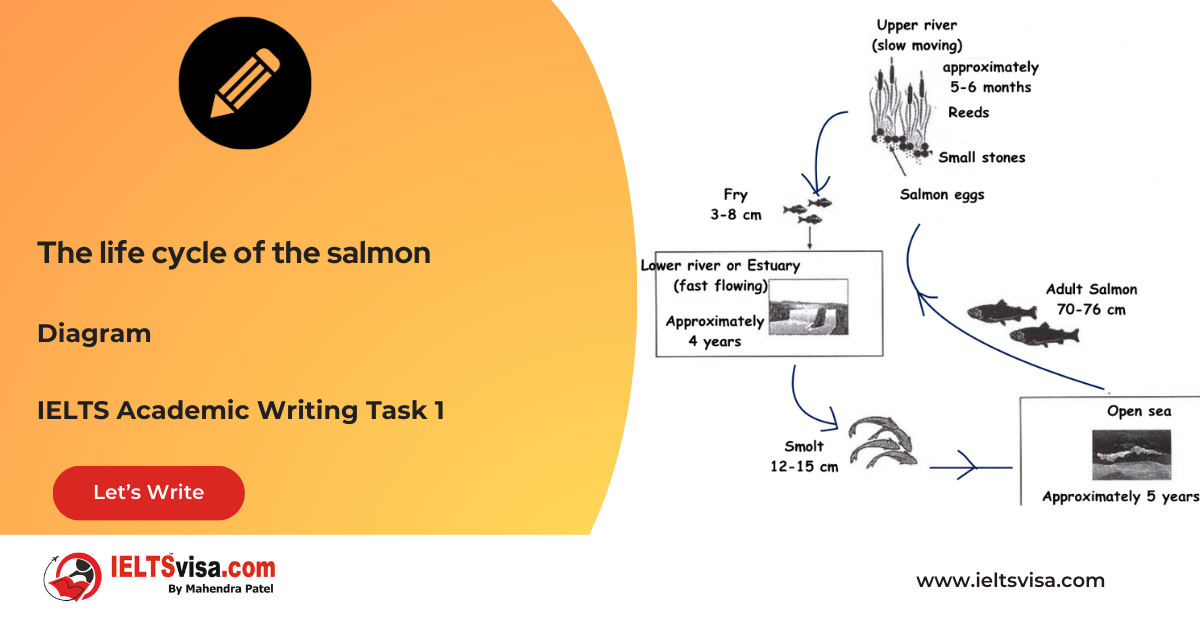
Task 1 – Diagram – The life cycle of the salmon
20:00 Start Pause Stop [df_adh_heading title_infix="IELTS Writing Task 1 Question" use_divider="on"...
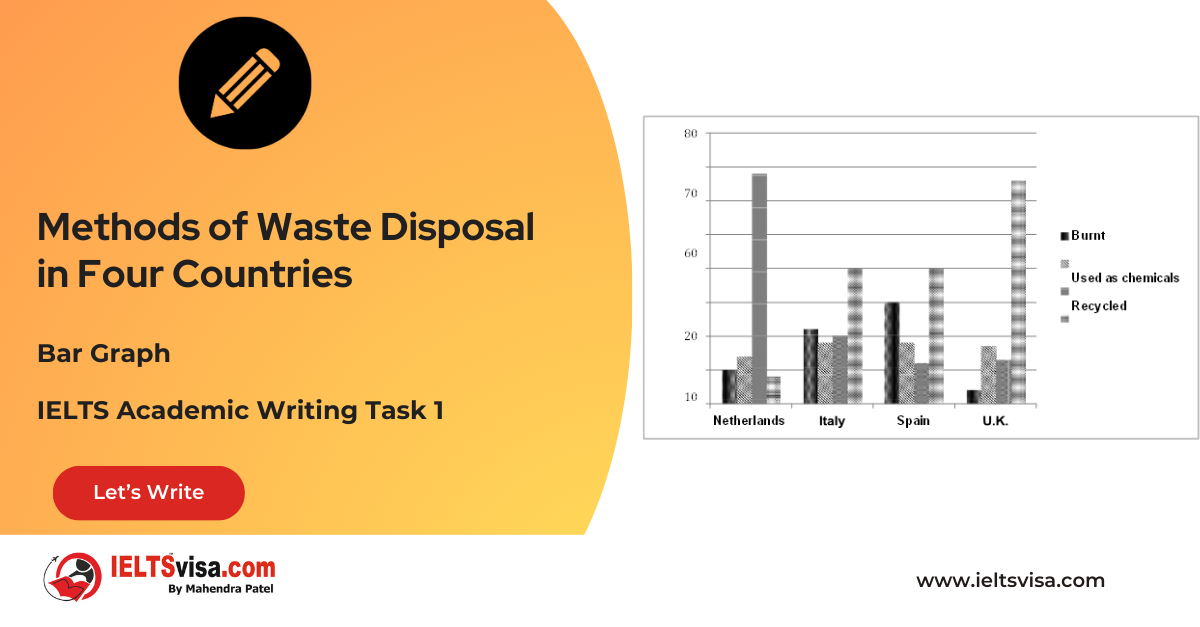
Task 1 – Bar Graph – Methods of Waste Disposal in Four Countries
[df_adh_heading title_infix="IELTS Writing Task 1 Question" use_divider="on"...
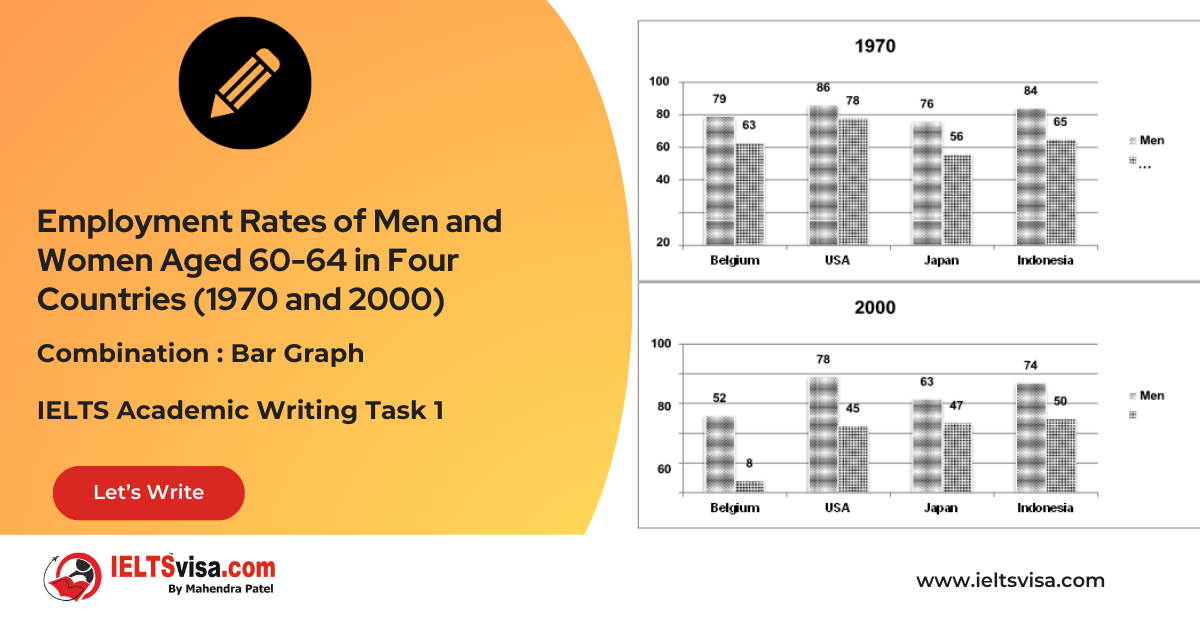
Task 1 – Combination : Bar Graph – Employment Rates of Men and Women Aged 60-64 in Four Countries (1970 and 2000)
[df_adh_heading title_infix="IELTS Writing Task 1 Question" use_divider="on"...
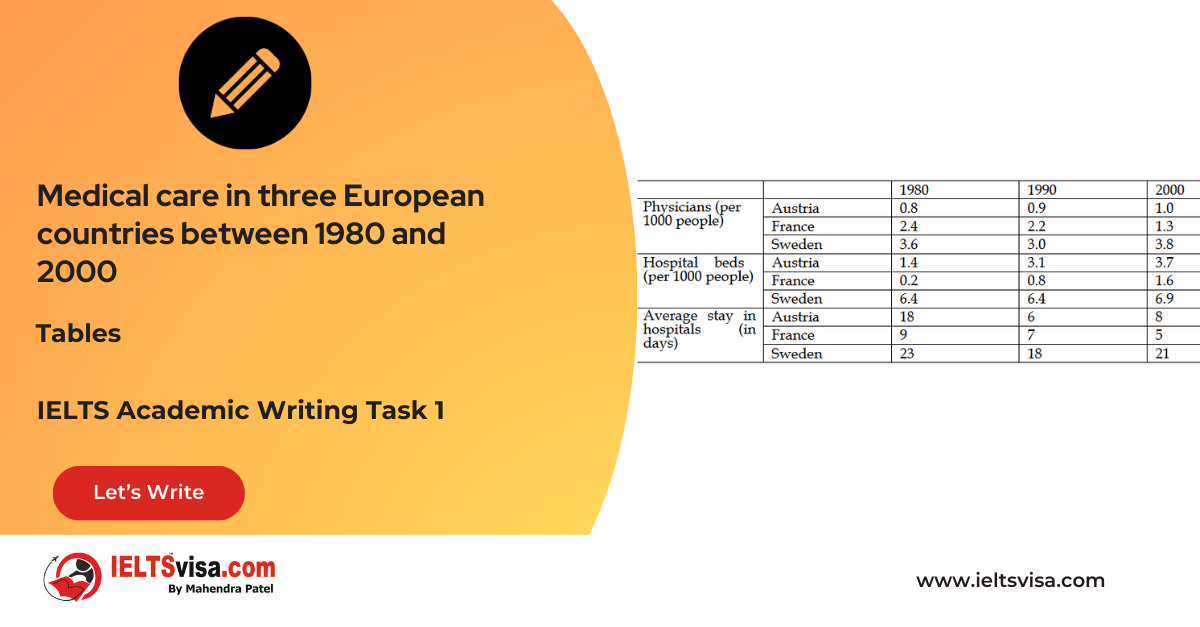
Task 1 – Table – The information about medical care in three European countries between 1980 and 2000
20:00 Start Pause Stop [df_adh_heading title_infix="IELTS Writing Task 1 Question" use_divider="on"...
Our IT Company Services


